Charting a bullish November start, S&P 500 ventures atop 4,600 mark
Focus: Transports challenge record close, Russell 2000's November breakout attempt, TRAN, COST, JNPR, MRK, CLF
U.S. stocks are higher early Monday, rising modestly to start November and the best six months seasonally.
Against this backdrop, the S&P 500 and Nasdaq Composite have tagged record highs, rising to build on each benchmark’s late-October breakout.
Editor’s Note: As always, updates can be directly accessed at chartingmarkets.substack.com.
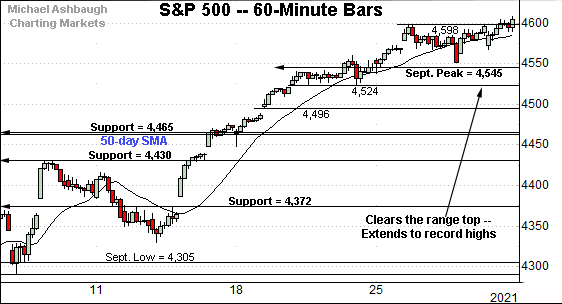
Before detailing the U.S. markets’ wider view, the S&P 500’s hourly chart highlights the past four weeks.
As illustrated, the S&P has extended its uptrend, tagging another record high.
The October close (4,605) marked the S&P’s first-ever close atop the 4,600 mark.
Tactically, the former range top (4,598) is followed by the September peak (4,545).
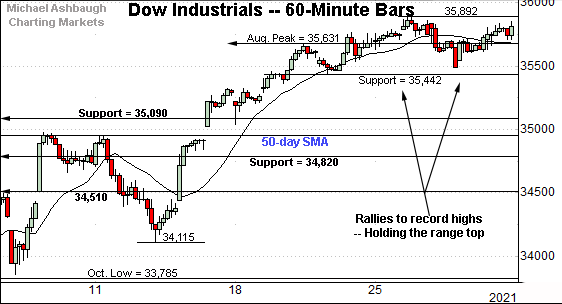
Meanwhile, the Dow Jones Industrial Average continues to hold its range top.
Tactically, recall the August peak (35,631) — formerly the Dow’s all-time high — is followed by the Dow’s two-week range bottom (35,442).
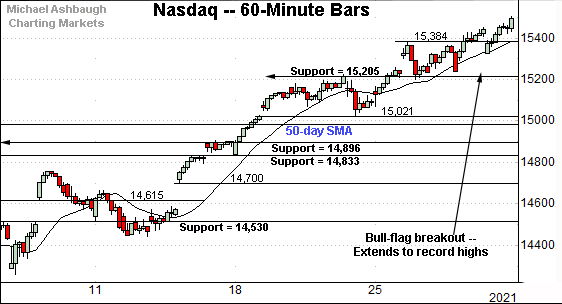
Against this backdrop, the Nasdaq Composite has extended its break to record highs.
Recent follow-through punctuates a bull flag underpinned by major support (15,205).
Delving deeper, the former range bottom (15,021) is followed by the 50-day moving average, currently 14,982.
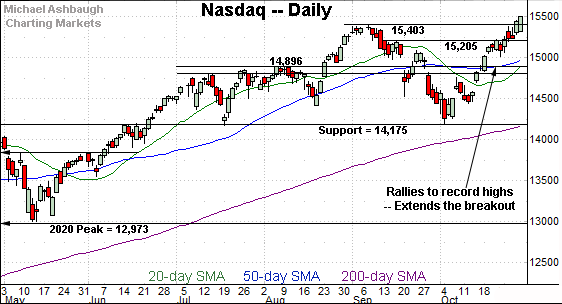
Widening the view to six months adds perspective.
On this wider view, the Nasdaq has extended a modest break to record highs.
From current levels, an intermediate-term target continues to project to the 16,550 area, detailed previously.
Conversely, the breakout point (15,403) pivots to first support.
Looking elsewhere, the Dow Jones Industrial Average continues to hold its range top.
Recent flattish price action punctuates a decisive mid-October breakout. Recall three of four closes registered atop the 20-day volatility bands amid a powerful two standard deviation breakout.
Tactically, the breakout point (35,631) is followed by the post-breakout low (35,442).
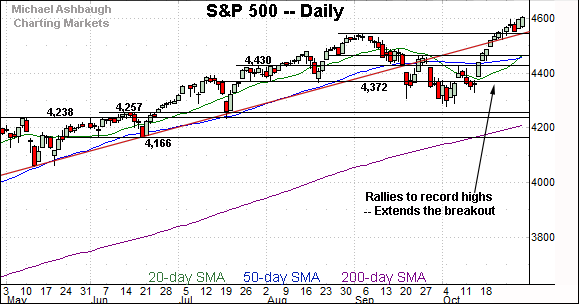
Meanwhile, the S&P 500 has extended a grinding-higher break to record territory.
The index tagged the 4,600 mark for the first time to conclude October.
Conversely, trendline support closely matches the breakout point (4,545).
The bigger picture
As detailed above, the major U.S. benchmarks are starting November — and the best six months seasonally — amid a bullish bigger-picture backdrop.
Consider that the S&P 500 and Nasdaq Composite tagged record highs to conclude October, and are vying to extend their respective uptrends to start this week.
Moving to the small-caps, the iShares Russell 2000 ETF remains range-bound.
To reiterate, overhead inflection points match the three-month range top (229.84) and the October peak (230.72).
The small-cap benchmark has ventured atop resistance early Monday. A breakout attempt is underway.
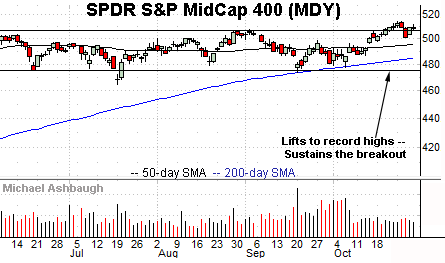
Elsewhere, the SPDR S&P MidCap 400 ETF is digesting a modest late-October breakout.
As detailed repeatedly, the prevailing upturn punctuates a prolonged five-month base, laying the groundwork for potentially material upside follow-through.
Tactically, the breakout point — the 506.00-to-507.60 area — is followed by the post-breakout low (500.76).
Placing a finer point on the S&P 500, the index has edged to its latest record high.
The prevailing upturn punctuates consecutive flag-like patterns, underpinned by the September peak (4,545) and the former range bottom (4,524).
From current levels, the former range top (4,598) pivots to support.
More broadly, the S&P 500’s six-month view remains relatively straightforward.
Tactically, trendline support closely matches the breakout point (4,545).
Delving deeper, more important support matches the late-September peak (4,465), the 50-day moving average, currently 4,462, and the 4,430 mark.
As detailed repeatedly, the S&P 500’s intermediate-term bias remains bullish barring a violation of the 4,430 area.
Conversely, an intermediate-term target projects to the 4,775-to-4,790 area — detailed previously — or about 3.7% to 4.0% above current levels.
Watch List
Drilling down further, the Dow Transports have reached a major technical test.
Specifically, the group is challenging its record close (15,943) and absolute record peak (16,170), both established about six months ago.
Against this backdrop, the prevailing flag pattern — the tight one-week range, hinged to the steep October rally — signals muted selling pressure, improving the chances of eventual follow-through.
Tactically, a breakout attempt is in play barring a violation of near-term support, circa 15,720.
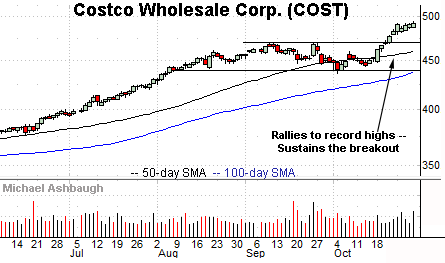
Costco Wholesale Corp. is a well positioned large-cap name.
As illustrated, the shares have recently knifed to all-time highs, clearing resistance matching the September peak.
The subsequent bull flag is a continuation pattern, positioning the shares to build on the initial rally. (Each session close has registered above the session open, post-breakout, signaling a near-term bullish bias.)
Tactically, near-term support (479.50) is followed by the firmer breakout point (470.50). The prevailing rally attempt is intact barring a violation.
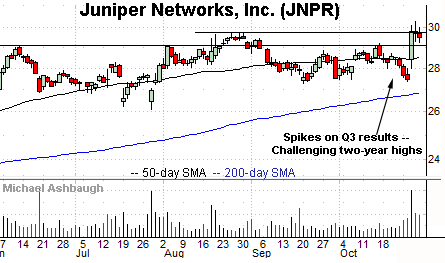
Juniper Networks, Inc. is a well positioned large-cap name.
Late last month, the shares briefly tagged two-year highs, rising amid a volume spike after the company’s quarterly results.
The subsequent pullback has been comparably flat, improving the chances of eventual follow-through.
Tactically, the former range top (29.20) pivots to support. A breakout attempt is in play barring a violation.
Initially profiled Oct. 18, Merck & Co., Inc. has returned 12.8% across about two weeks. (Yield = 3.0%.)
The shares initially spiked four weeks ago, gapping higher after the company reported positive trial results for its COVID-19 treatment.
The subsequent pullback has indeed been underpinned by gap support (76.65), and punctuated by decisive upside follow-through.
More immediately, the shares are challenging record highs matching the 2019 peak (88.33).
Last week’s high (88.46) marked a fractional new record, though the retest technically remains underway. Tactically, a sustained posture above the former range top (84.55) signals a firmly-bullish bias.
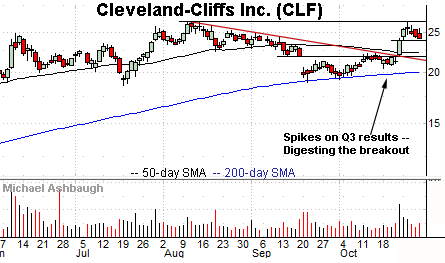
Finally, Cleveland-Cliffs, Inc. is a well positioned large-cap steel producer.
Late last month, the shares knifed atop trendline resistance, rising after the company’s quarterly results. (The October peak marked a nominal seven-year high.)
The ensuing pullback has been comparably flat, placing the shares 9.9% under the October peak.
Tactically, near-term support (23.85) is followed by the 50-day moving average, currently 22.30. A sustained posture higher signals a bullish bias.


