Bearish momentum persists, S&P 500 challenges 200-week moving average
Focus: Nasdaq tags two-year lows, Dow industrials register bearish island reversal, S&P 500 challenges 200-week moving average
Technically speaking, the major U.S. benchmarks have failed to follow-through on an initially strong fourth-quarter start.
Against this backdrop, the S&P 500 has reversed sharply from major resistance (3,790), pulling in to a potentially consequential test of the 200-week moving average. The response to this area, over the next several sessions, will likely add color.
Editor’s Note: As always, updates can be directly accessed at https://chartingmarkets.substack.com.
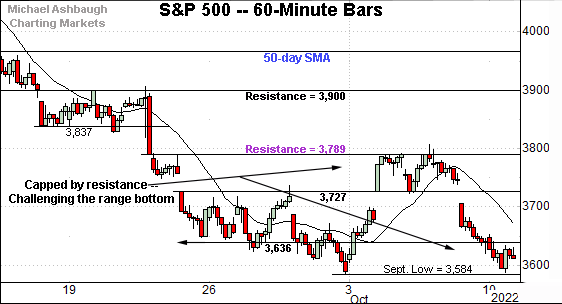
Before detailing the U.S. markets’ wider view, the S&P 500’s hourly chart highlights the past four weeks.
As illustrated, the S&P has balked at major resistance.
The specific area matches the Sept. 21 low (3,789) — detailed previously — established after the Federal Reserve’s latest policy statement.
The October closing high (3,790) has matched resistance (3,789) and selling pressure has surfaced.
More immediately, a retest of the September low (3,584) remains underway. This marks the S&P 500’s lowest level since November 2020.
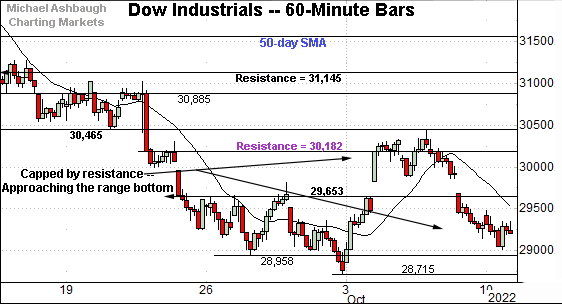
Meanwhile, the Dow Jones Industrial Average has also pulled in.
Recall the index briefly ventured atop its corresponding resistance (30,182), a level also established after the Federal Reserve’s policy statement.
The October peak (30,454) registered near more distant resistance (30,465), detailed previously.
Slightly more broadly, the Dow is not pressing its range bottom, outpacing the other major benchmarks.
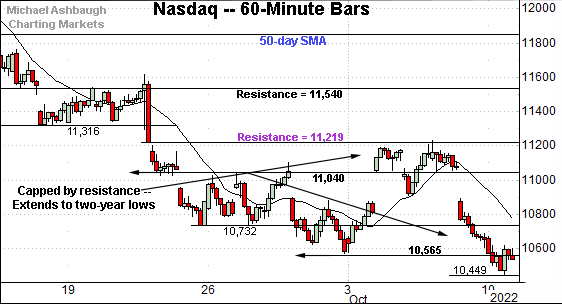
Against this backdrop, the Nasdaq Composite has pulled in more aggressively from major resistance.
Here again, the specific area matches the Sept. 21 low (11,219) established after the Fed’s policy statement.
The Nasdaq has since pulled in to two-year lows, notching its lowest level since July 2020.
Widening the view to six months adds perspective.
On this wider view, the Nasdaq is challenging major support.
The familiar area matches the June low (10,565) and September low (10,572), levels defining a two-year range bottom.
On further weakness, a downside target matches the Feb. 2020 peak (9,838) formerly the Nasdaq’s all-time high established immediately before the pandemic.
Conversely, gap resistance (10,891) is followed by firmer overhead at 11,220, a level also detailed on the hourly chart. Tactically, a rally atop this area would place the brakes on bearish momentum.
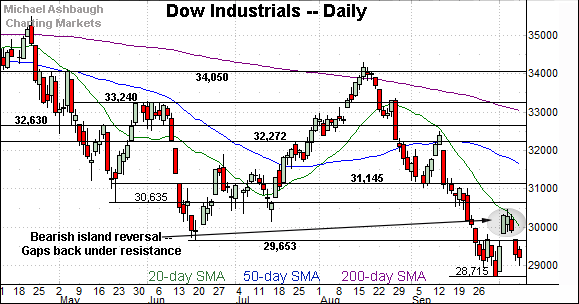
Looking elsewhere, the Dow Jones Industrial Average has reversed sharply from the October peak.
The prevailing downturn punctuates a bearish island reversal defined by gaps to start the fourth quarter.
Tactically, the breakdown point (29,653) is closely followed by gap resistance (29,685). A rally atop this area would mark technical progress.
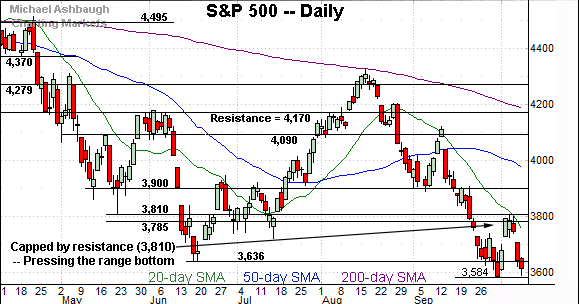
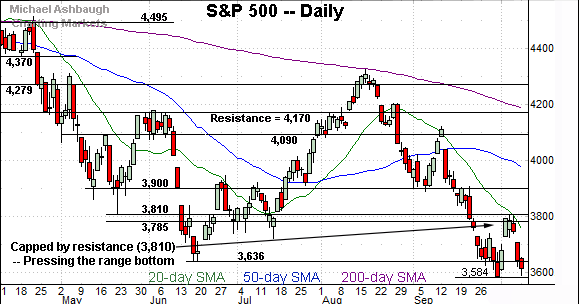
Meanwhile, the S&P 500 has balked at major resistance.
The specific area matches the May low (3,810). Separately, recall the June close (3,785) — also the second-quarter close — matches the Fed-induced resistance (3,789) detailed on the hourly chart.
The October closing peak (3,790) and absolute October peak (3,807) have registered nearby.
(On a granular note, each major U.S. benchmark’s Oct. peak has registered near the 20-day moving average (in green) a widely-tracked near-term trending indicator.)
The bigger picture
As detailed above, the major U.S. benchmarks have failed to follow-through on a strong fourth-quarter start.
Against this backdrop, the S&P 500 and Nasdaq Composite have nailed major resistance — S&P 3,790 and Nasdaq 11,220 — and aggressive selling pressure has subsequently surfaced. (See the hourly charts.)
In fact, the prevailing downturn has been punctuated by Friday’s 9-to-1 down day on the NYSE, likely neutralizing the initially strong October start. (Declining volume surpassed advancing volume by a 9-to-1 margin.)
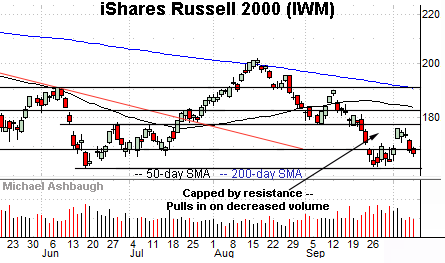
Moving to the small-caps, the iShares Russell 2000 ETF (IWM) is digesting the September downdraft.
The recent rally attempt has been flattish, in the broad sweep, and capped by resistance. Tactically, the 176.20-to-177.50 area marks notable overhead.
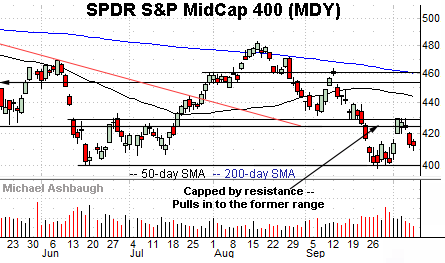
Similarly, the SPDR S&P MidCap 400 ETF (MDY) is digesting the late-September downdraft.
Here again, the rally attempt has been capped by resistance, and punctuated by a pullback amid recently decreased volume.
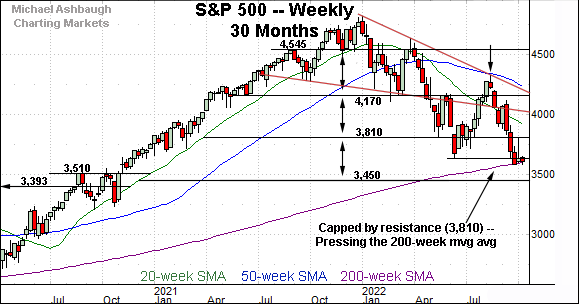
Returning to the S&P 500, this next chart is a weekly view spanning 30 months. Each bar on the chart represents one week.
As illustrated, the S&P has balked at major resistance (3,810), detailed previously. (See the Sept. 27 review.)
Last week’s high (3,807) registered nearby, and selling pressure has surfaced.
More immediately, the index is pressing its 200-week moving average, currently 3,600, a truly longer-term indicator.
Until the current retest, the S&P had not traded under its 200-week moving average since March 2020, amid a brief three-week stint lower, as the pandemic kicked off.
Broadening before the pandemic era, the S&P 500 has not registered three straight weekly closes under the 200-week moving average since 2010, as the markets re-emerged from the financial crisis, and the Great Recession.
So sustained follow-through under the 200-week moving average would signal a bearish milestone of sorts — and arguably, a change in market structure — amid price action not registered since 2010. The prevailing retest of this area is a “watch out.”
Against this backdrop, the prevailing downturn originates from trendline resistance to punctuate a massive third-quarter whipsaw. The S&P 500 is tenuously positioned to start the fourth quarter.
Returning to the six-month view adds color to the third-quarter whipsaw, the round-trip move, effectively spanning July through September.
Recall the August peak registered just one point under the 200-day moving average, a widely-tracked longer-term trending indicator. The August peak registered on Aug. 16, the mid-point of the third quarter. (Also see the failed trendline test on the weekly chart.)
Against this backdrop, the third-quarter whipsaw projects to the 2,950 area. Start with the August peak, and subtract the June low: 4,325 - 3,636 = 689 points. Then, subtract the result from the breakdown point: 3,636 - 689 = 2,947. (The Sept. 29 review included a typo, resulting in a projection toward the 3,000 mark. Either way, the pattern projects firmly lower from current levels.)
A non-technical path to the same area would be to place a 14 price/earnings multiple on forward S&P 500 earnings of $210 per share. Under this view, 14 x 210 = S&P 2,940.
Tactically, the 3,727 area marks notable overhead. A sustained rally atop this area would mark technical progress. (See the hourly chart.)
Conversely, important support spans from 3,584 to 3,600, levels matching the September low and the 200-week moving average. The quality of the rally attempt from this area, or lack thereof, will likely add color.
Beyond specific levels, the S&P 500’s longer-term bias remains bearish pending extensive repairs. Establishing a durable low will more likely be a process than an event.


