Charting a strong Q4 start, S&P 500 nails major resistance (3,790)
Focus: Nasdaq nails major support, S&P 500 rises from island reversal, Small- and mid-caps bottom before major bencmarks
Technically speaking, the major U.S. benchmarks have shown signs of a pulse, rising sharply amid an unusually strong October start.
Against this backdrop, the S&P 500 has nailed major resistance — the 3,790 area — a level defining the bull-bear battleground to start the fourth quarter.
Editor’s Note: As always, updates can be directly accessed at https://chartingmarkets.substack.com.
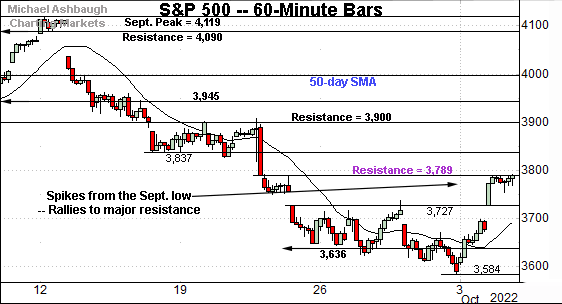
Before detailing the U.S. markets’ wider view, the S&P 500’s hourly chart highlights the past four weeks.
As illustrated, the S&P has knifed to major resistance.
The specific area matches the Sept 21 low (3,789) — detailed previously — established immediately after the Federal Reserve’s latest policy statement.
Tuesday’s close (3,790) matched resistance (3,789) to punctuate a two-session, 5.7% rally from last week’s low.
(On a granular note, Tuesday’s session low (3,726) matched the September gap (3,727), also detailed previously.)
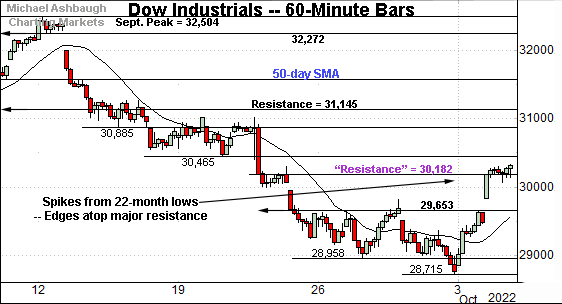
Meanwhile, the Dow Jones Industrial Average has staged a two-session, 5.6% rally from the September low.
Amid the upturn, Tuesday’s close registered slightly atop resistance (30,182) established after the Federal Reserve’s policy statement.
Tactically, this area remains an inflection point.
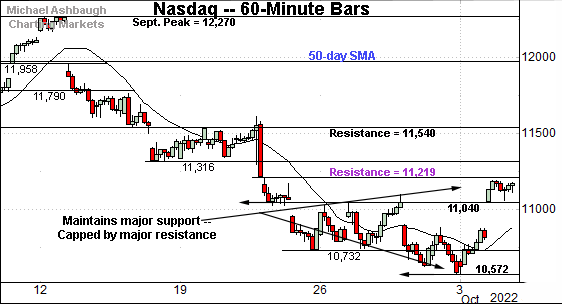
Against this backdrop, the Nasdaq Composite has registered a two-session 5.7% bullish reversal from last week’s low to Tuesday’s close.
Like the S&P 500, the Nasdaq’s rally has been capped by its corresponding resistance (11,219), also detailed previously.
The week-to-date peak (11,190) has registered slightly lower.
(On a granular note, Tuesday’s session low (11,044) matched the 11,040 inflection point, an area detailed previously, and also illustrated below.
Combined, the Nasdaq Composite and S&P 500 have staged strong two-day rallies — both 5.7% — rising to challenge a Fed-induced inflection point.
Widening the view to six months adds perspective.
On this wider view, the Nasdaq has knifed from major support (10,565).
The September low (10,572), established Friday to conclude the third quarter, registered within seven points.
The successful retest of this area arguably contributed to the aggressive rally off the low.
Tactically, the 11,220 area is followed by the 11,540 resistance, the latter better illustrated on the hourly chart. Follow-through atop these inflection points would signal the rally attempt is intact.
Conversely, the May low (11,035) closely matches gap support (11,044). A nearly immediate violation of this area would raise a technical question mark.
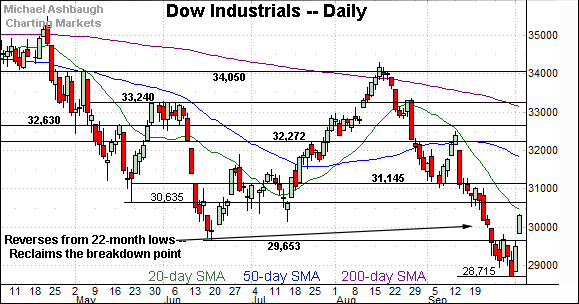
Looking elsewhere, the Dow Jones Industrial Average has knifed from 22-month lows.
In the process, the index has reclaimed its breakdown point (29,653) knifing through a less-charted patch.
From current levels, the 30,635 area marks an overhead inflection point.
(On a granular note, Monday’s session high (29,647) closely matched the breakdown point (29,653) — detailed previously — to punctuate a 765-point single-day spike.)
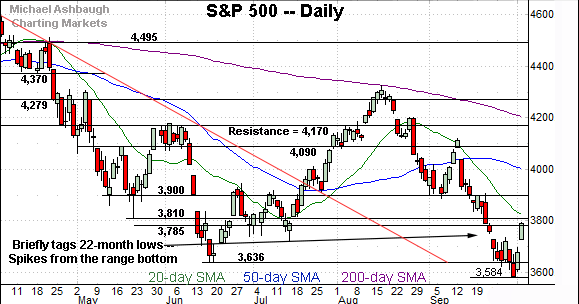
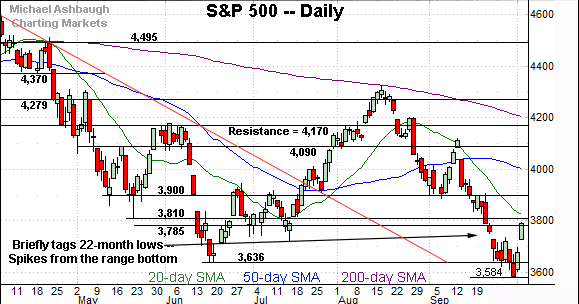
Meanwhile, the S&P 500 has knifed to its first significant resistance.
Tactically, the June close (3,785) — also the second-quarter close — closely matches the Fed-induced resistance (3,789) detailed on the hourly chart.
Tuesday’s close (3,790) effectively matched resistance amid an unusually strong fourth-quarter start.
The bigger picture
As detailed above, the major U.S. benchmarks have rallied sharply to start October.
The strong fourth-quarter start marks the S&P 500’s largest back-to-back gain (two-session gain) since April 2020.
Amid the upturn, each big three benchmark has closely observed well-defined technical levels despite genuinely wide-ranging price action. Generally speaking, technical price action signals order, a constructive backdrop for market bulls. (Caveats apply, as detailed below.)
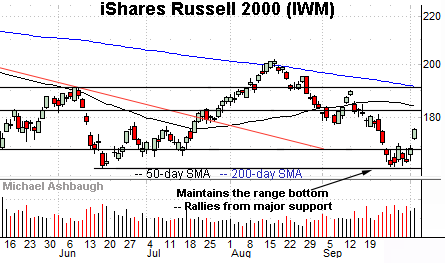
Moving to the small-caps, the iShares Russell 2000 ETF (IWM) has spiked from its range bottom.
The sharp upturn punctuates a successful test of the June low (162.78). The September low (163.28) registered nearby.
Perhaps more notably, the small-cap benchmark registered its September low three sessions before the S&P 500’s corresponding low.
From current levels, additional resistance (177.50) is followed by firmer overhead in the 182.50 area.
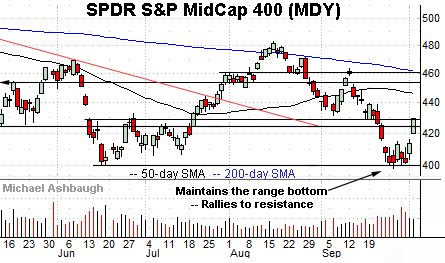
Similarly, the SPDR S&P MidCap 400 ETF (MDY) has spiked from major support.
Here again, the mid-cap benchmark’s Sept. 27 low registered three days before the S&P 500’s Sept. 30 low to conclude last week.
Slightly more broadly, the small- and mid-cap benchmarks have rallied amid respectable — though not off-the-charts — total volume.
Market breadth registers bullish extremes to start Q4
Beyond the charts, the strong fourth-quarter start has been directionally sharp, punctuated by consecutive single-day S&P 500 rallies exceeding 2.5%.
Moreover, the rally’s internal strength has pressed bullish extremes.
To start, Monday’s NYSE advancing volume surpassed declining volume by an 8-to-1 margin. Then, bullish momentum accelerated amid Tuesday’s 13-to-1 up day.
As always, in a textbook world, two 9-to-1 up days — across about a seven-session window — conventionally signals a major trend shift.
So collectively, the S&P 500’s directionally sharp two-day spike — fueled by two 8-to-1 up days — signals a stake-in-the-ground reversal, potentially sufficient to underpin a durable market low.
Under normal market conditions, the strong October start would signal a bright-line bullish green light.
One huge caveat: The two-day rally has been at least partly influenced by central bank actions outside the U.S. Broadly speaking, central bank-fueled rallies are not bullish.
Cast in this light, the strong October start may simply be a function of the primary downtrend’s aggressiveness. Time will tell.
(As reference, the U.S. markets just registered the worst September since 2002, pressured amid firmly-bearish momentum detailed last week.)
Returning to the S&P 500, the index has spiked to its Fed-statement-fueled low. (See the Sept. 21 long red bar.)
To reiterate, Tuesday’s close (3,790) matched resistance (3,789) detailed previously.
Tactically, selling pressure has surfaced, though the retest of this area — potentially across the next several sessions — should be a useful bull-bear gauge.
(Also recall Tuesday’s session low (3,726) matched the September gap (3,727), detailed previously. Combined, the prevailing upturn punctuates a bullish island reversal, of sorts, a high-reliability reversal pattern.)
Returning to the S&P 500’s six-month view, the index has knifed from 22-month lows.
Tactically, the 3,727 area marks well-defined support, defined by gaps at the turn of the month. (In this case, also the turn of the quarter.)
The S&P’s rally attempt is intact to the extent this area holds.
More broadly, the rally attempt’s longer-term viability remains an open question.
On further strength, the 3,900 mark defines major resistance. Eventual follow-through atop this area would signal sustained momentum, strengthening the intermediate-term bull case.
Beyond specific levels, the S&P 500’s longer-term bias remains bearish pending more extensive repairs.
Editor’s Note: No new setups today. The next review will be published Tuesday, Oct. 11.


