S&P 500 violates 200-day average amid tandem 9-to-1 down days
Focus: Charting U.S. sector damage, Gold takes flight, 10-year yield plunges to key trendline, XLF, KRE, KIE, TNX, GLD
Technically speaking, an aggressive March downdraft has inflicted relatively broadly-based damage to the major U.S. benchmarks.
Against this backdrop, the S&P 500 has violated its 200-day moving average — a widely-tracked longer-term trending indicator — and subsequently observed this area as resistance. The price action signals a bearish bigger-picture bias, pending repairs.
Editor’s Note: As always, updates can be directly accessed at https://chartingmarkets.substack.com.
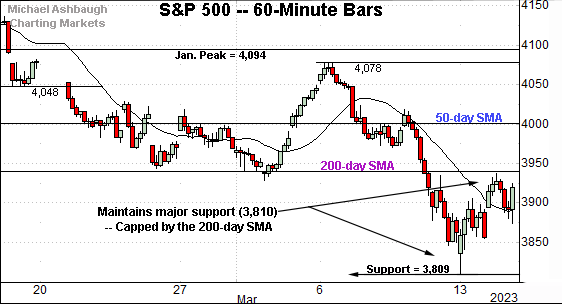
Before detailing the U.S. markets’ wider view, the S&P 500’s hourly chart highlights the past four weeks.
As illustrated, the S&P has whipsawed amid two key technical levels.
To start, the index has nailed major support (3,810) a familiar inflection point also detailed on the daily chart. The March low (3,809), established Monday, registered nearby.
Separately, the S&P has violated its 200-day moving average, currently 3,940, and observed this area as resistance. The week-to-date peak (3,937) has registered just under the 200-day.
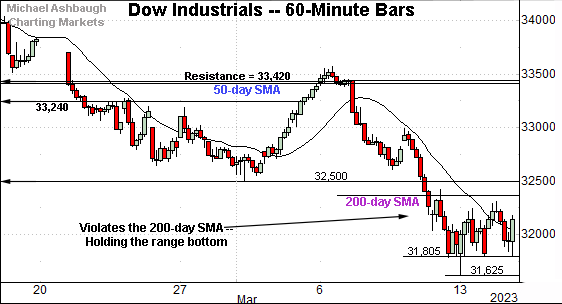
Meanwhile, the Dow Jones Industrial Average has also turned lower.
In the process, the index has violated its 200-day moving average, currently 32,386.
Here again, the subsequent rally attempt has been comparably flat, and capped by the 200-day. Bearish price action.
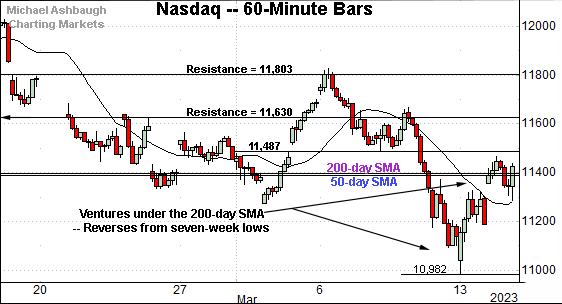
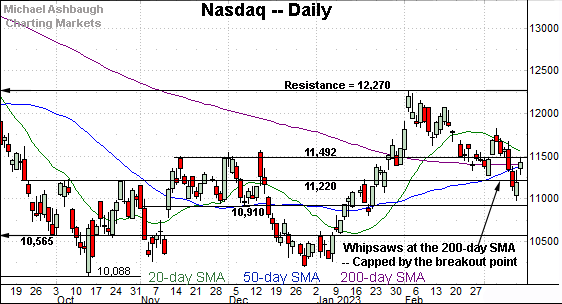
Against this backdrop, the Nasdaq Composite is challenging two key inflection points. Specifically:
The 50-day moving average, currently 11,398.
The 200-day moving average, currently 11,399.
Both areas are also detailed on the daily chart below.
Widening the view to six months adds perspective.
On this wider view, the Nasdaq has whipsawed at three inflection points. Specifically:
The former breakout point (11,492) an area also detailed on the hourly chart.
The 50-day moving average, currently 11,398.
The 200-day moving average, currently 11,399.
Tactically, the 11,400 area remains an important bull-bear fulcrum. A sustained break lower would signal a bearish bigger-picture bias.
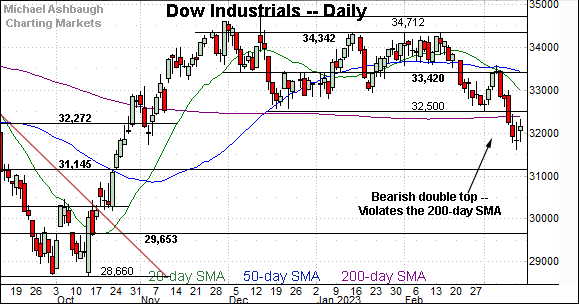
Looking elsewhere, the Dow Jones Industrial Average has plunged to a less-charted patch.
In the process, the index has violated its 200-day moving average, currently 32,386, a widely-tracked longer-term trending indicator.
More broadly, the downturn punctuates a double top, a bearish pattern detailed previously. (Swift downside follow-through has indeed registered.)
Tactically, the 200-day moving average is closely followed by the breakdown point (32,500). A reversal atop this area would place the brakes on bearish momentum.
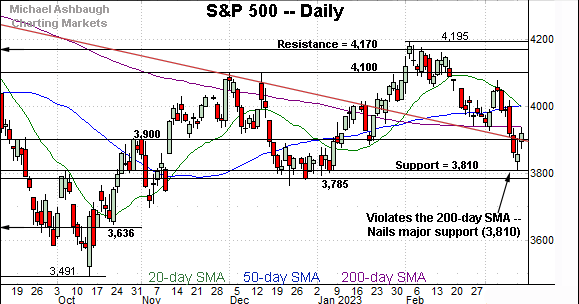
Meanwhile, the S&P 500 has whipsawed amid a March downdraft.
Tactically, the index has violated its 200-day moving average (in purple) an area that has capped the subsequent rally attempt. (Also see the hourly chart.)
Also recall the S&P’s bounce from the March low originates from major support (3,810).
The bigger picture
As detailed above, the U.S. benchmarks’ March downdraft has inflicted relatively broadly-based technical damage.
On a headline basis, the S&P 500 and Dow industrials have concurrently violated their 200-day moving averages — widely-tracked longer-term trending indicators — and subsequently observed each area as resistance.
The price action raises the flag to a bearish primary trend shift.
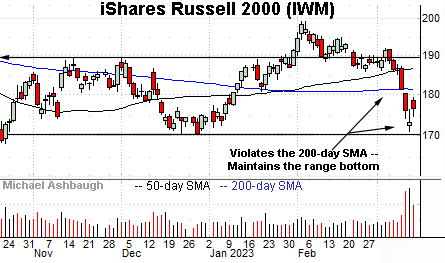
Moving to the small-caps, the iShares Russell 2000 ETF (IWM) has turned firmly lower, violating its 200-day moving average amid a volume spike.
The downturn has thus far been underpinned by the four-month range bottom (170.35). The quality of the rally attempt from this area will likely add color.
Meanwhile, the SPDR S&P MidCap 400 ETF (MDY) has also turned lower, pulling in to whipsaw at the 200-day moving average, currently 448.50.
Combined, the small- and mid-caps have traversed their former range across just three sessions. Shaky, if not outright bearish, price action.
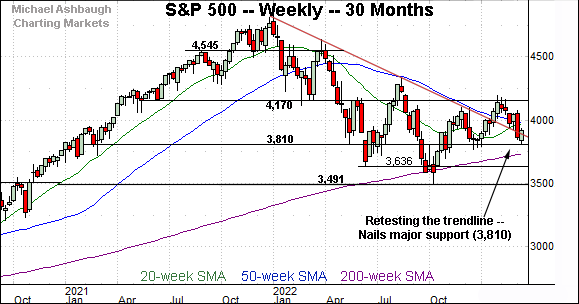
Returning to the S&P 500, this next chart is a weekly view spanning 30 months. Each bar on the chart represents one week.
As illustrated, the S&P has nailed major support (3,810) a familiar inflection point, detailed repeatedly. (See for instance, the March 1 review.)
The March low (3,809) effectively matched major support, a level also detailed on the S&P 500’s daily chart. The quality of the rally from this area will likely add color.
Slightly more broadly, an extended test of key trendline support remains underway.
Market breadth registers bearish extremes
Beyond the charts, the March downdraft has been punctuated by aggressively bearish market breadth.
In fact, the selling pressure encompassed a nearly 12-to-1 down day, and a 9-to-1 down day, across consecutive sessions to conclude last week. (NYSE declining volume surpassed advancing volume by the stated margin.)
As always, in a textbook world, two 9-to-1 down days — across about a seven-session window — reliably signals a material trend shift.
In the current case, the 9-to-1 down days fueled the S&P 500’s violation of its 200-day moving average, an event also consistent with a primary trend shift.
Narrowing to the S&P 500’s six-month view adds perspective.
On this daily chart, the S&P 500 has violated its 200-day moving average — (amid consecutive 9-to-1 down days) — plunging to nail major support (3,810).
By comparison, the initial rally attempt has been fueled by lackluster momentum — (a less than 3-to-1 up day) — stalling just under the 200-day moving average. Bearish price action.
Against this backdrop, S&P 3,940 remains an important bull-bear fulcrum.
Tactically, a sustained posture under S&P 3,940 signals a bearish intermediate- to longer-term bias. The week-to-date peak (3,937) has registered nearby amid a failed retest from underneath. The next several sessions may add color.
Also see March 1: Bearish momentum persists, Nasdaq challenges 200-day average.
Also see March 9: Charting market cross currents, S&P 500's March rally attempt fades.
Editor’s note: The next review will be published Tuesday, March 21.
Watch List
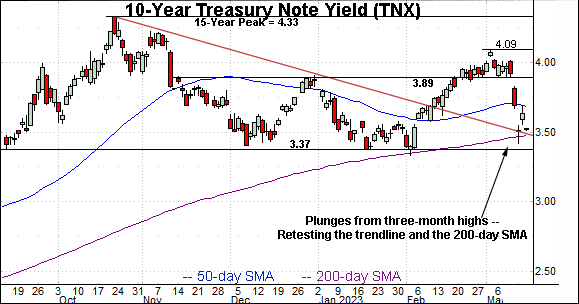
Drilling down further, the 10-year Treasury note yield (TNX) — profiled last week (amid a quite different sentiment backdrop) — has reversed course, pressured amid a flight to safety.
In the process, the yield has violated its breakout point (3.89) plunging as much as 50 basis points across just two sessions.
Tactically, trendline support closely matches the 200-day moving average, currently 3.47. Delving deeper, the 3.33-to-3.37 area defines a six-month range bottom.
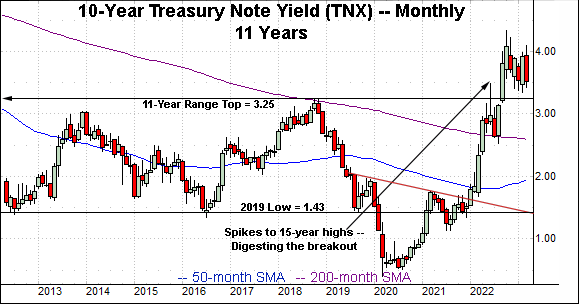
More broadly, recall the yield’s former range top (3.25) rests slightly lower, an area detailed on the monthly chart. Eventual downside follow-through under these areas would raise the flag to a longer-term structural shift.
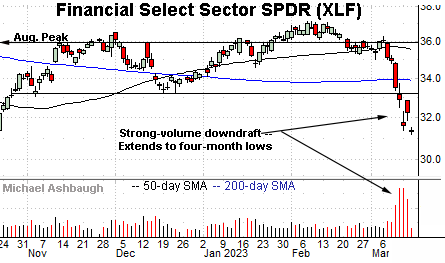
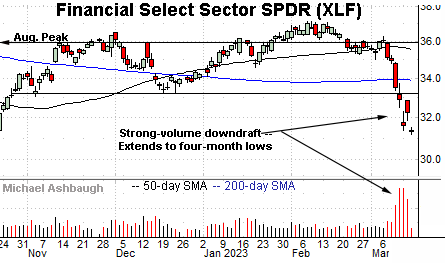
Moving to U.S. sectors, the Financial Select Sector SPDR (XLF) has plunged to four-month lows, violating its 200-day moving average amid a volume spike.
Tactically, the breakdown point (33.20) pivots to well-defined resistance. A swift reversal higher would mark a step toward stabilization.
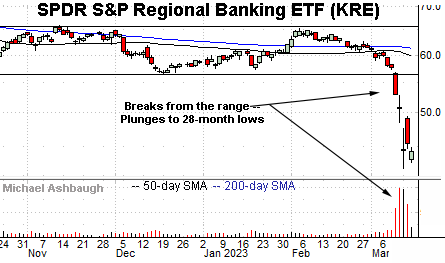
Meanwhile, the SPDR S&P Regional Banking ETF (KRE) has plunged more aggressively, tagging 28-month lows amid a volume spike.
Tactically, the post-breakdown peak (49.40) marks an inflection point. A reversal atop this area would mark technical progress.
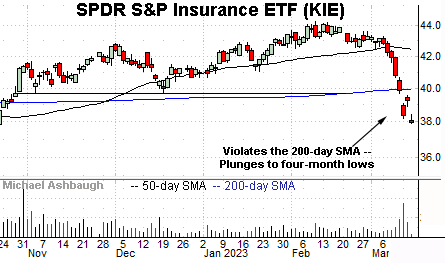
Beyond the banks, the SPDR S&P Insurance ETF (KIE) has tagged four-month lows, pressured amid a March downdraft.
Tactically, the breakdown point (39.74) roughly matches the 200-day moving average, currently 39.92. The pending retest from underneath will likely add color. (This area would be expected to draw selling pressure on the first test.)
Concluding with a bright spot, the SPDR Gold Shares ETF (GLD) has taken flight, rising amid a safe-haven trade.
Tactically, gap support (176.30) is followed by the 50-day moving average, currently 174.30. The prevailing rally attempt is intact barring a violation.

