Charting market cross currents, S&P 500's March rally attempt fades
Focus: Apple maintains key trendline, 10-year yield holds the breakout point, U.S. dollar presses 200-day average, TNX, UUP, AAPL, AMZN
Technically speaking, the major U.S. benchmarks have whipsawed to start March, vacillating amid uneven price action.
Against this backdrop, the S&P 500 is digesting a lukewarm rally from its 200-day moving average, while the Dow Jones Industrial Average has pulled in amid a developing double top.
Editor’s Note: As always, updates can be directly accessed at https://chartingmarkets.substack.com.
Before detailing the U.S. markets’ wider view, the S&P 500’s hourly chart highlights the past four weeks.
As illustrated, the S&P is off to a jagged March start.
The initial spike from its 200-day moving average has faded, and the index has pulled in to retest the 50-day moving average, currently 4,000.
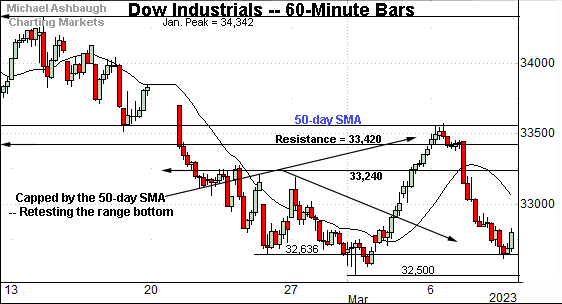
Similarly, the Dow Jones Industrial Average has whipsawed to start March.
Tactically, the early-month rally has been capped by the 50-day moving average, currently 33,518.
Recall the 50-day has marked a bull-bear inflection point, also detailed on the daily chart.
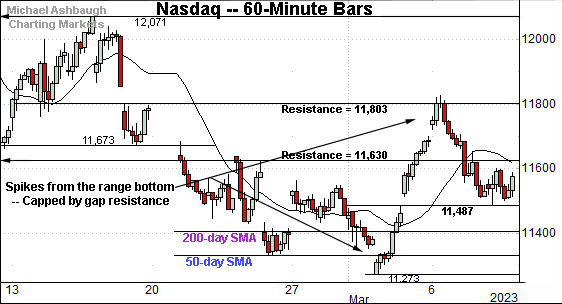
Against this backdrop, the Nasdaq Composite has strengthened, in some respects, versus the other benchmarks.
This is the only major benchmark positioned atop its 50-day moving average.
Separately, the index has reclaimed its former breakout point — the 11,490 area — a level better illustrated below.
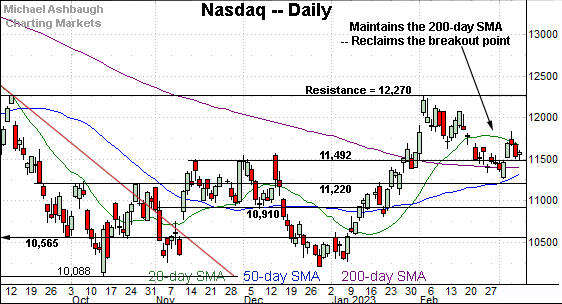
Widening the view to six months adds perspective.
On this wider view, the Nasdaq has bounced from a jagged test of its 200-day moving average, currently 11,405.
In the process, the index has reclaimed its former breakout point (11,492). The week-to-date low (11,487) has registered within five points.
Delving deeper, the 50-day moving average, currently 11,332, is rising within view.
To reiterate, as the 50- and 200-day moving averages converge, this area becomes a notable bull-bear fulcrum. (The crossover might be about three to five sessions off depending on the price action ahead.)
Looking elsewhere, the Dow Jones Industrial Average has taken a tenuous turn.
Recall selling pressure accelerated last month, amid the Dow’s violation of the 50-day moving average (in blue).
The subsequent rally attempt has been capped by the 50-day moving average, an area that has drawn selling pressure.
More broadly, the prevailing downturn has registered amid a developing double top defined by the November and February peaks.
Tactically, the prevailing range bottom (32,500) is followed by the slightly deeper 200-day moving average, currently 32,395. An eventual violation of the 32,400-to-32,500 area would raise a caution flag, opening the path to potentially swift downside follow-through.
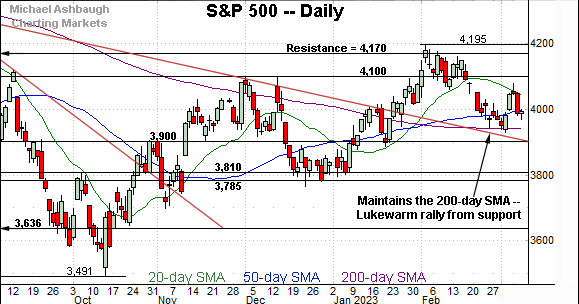
Meanwhile, the S&P 500 is digesting a lukewarm March rally attempt.
The initial spike from the 200-day moving average, currently 3,941, has faded amid a pullback from the March peak.
Notably, the upturn stalled near the 20-day moving average, currently 4,034, a widely-tracked near-term trending indicator.
The bigger picture
As detailed above, the major U.S. benchmarks have whipsawed to start March, vacillating amid a backdrop that is not one-size-fits-all.
Amid the cross currents, the S&P 500 and Nasdaq Composite are digesting lukewarm rallies from the 200-day moving average.
Elsewhere, the Dow Jones Industrial Average has observed its 50-day moving average as resistance, amid an increasingly tenuous bigger-picture backdrop. (See the daily charts.)
Moving to the small-caps, the iShares Russell 2000 ETF (IWM) is off to a sluggish March start.
Tactically, the small-cap benchmark has asserted a tight range, capped by its former breakout point (189.90).
Delving slightly deeper, an extended test of the 50-day moving average, currently 186.50, remains underway. Consecutive closes have registered fractionally higher.
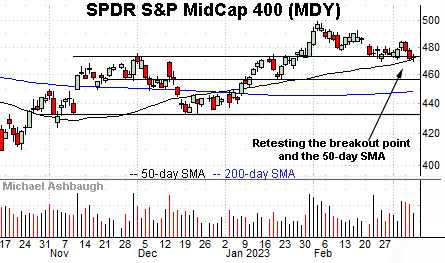
Similarly, the SPDR S&P MidCap 400 ETF (MDY) is testing notable technical territory.
As illustrated, the mid-cap benchmark has notched consecutive closes slightly under its breakout point (475.15).
And here again, an extended test of the 50-day moving average, currently 471.65, remains in play. Recall the 50-day marked a December inflection point.
More broadly, the prevailing downturn has been fueled by increased volume to start March.
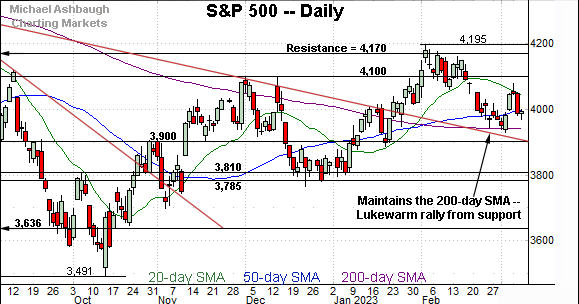
Returning to the S&P 500, the index is digesting an early-March bounce from major support.
Against this backdrop, recall the 200-day moving average, currently 3,941, loosely tracks a key trendline, an area that capped the index at the August and December peaks.
Tactically, this makes the 3,900-to-3,940 area important territory. The S&P 500’s bullish intermediate- to longer-term bias gets the benefit of the doubt barring a violation.
The response to the monthly U.S. jobs report, and Tuesday’s CPI data, will likely add color.
Editor’s note: The next review will be published Wednesday, March 15.
Watch List
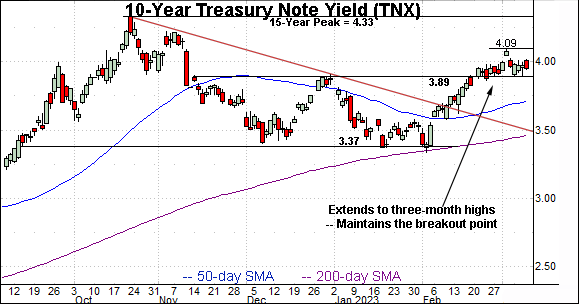
Drilling down further, the 10-year Treasury note yield (TNX) has sustained a recent breakout.
Late last month, the yield tagged three-month highs, punctuating a double bottom defined by the December and February lows.
The subsequent sideways range has been underpinned by the breakout point (3.89) an area detailed previously. (The March low (3.89) has precisely matched the breakout point.)
On further strength, an upside target continues to project to the 4.40 area from the prior range.
Meanwhile, the Invesco U.S. Dollar Bullish Fund (UUP) — a U.S. dollar proxy — has turned higher, rising amid surging Treasury yields.
As always, rising interest rates make a native currency (in this case, the dollar) more attractive versus competing currencies, generally sending it higher.
Against this backdrop, the dollar is pressing its marquee 200-day moving average, currently 28.60, an area matching the December breakdown point (28.50).
Tactically, follow-through atop the 200-day would signal a primary trend shift, presenting a U.S. stock market headwind. The prevailing retest from underneath will likely add color.
Moving to specific names, Dow 30 component Apple Inc. (AAPL) — most recently profiled Feb. 7 — is acting well technically.
The shares initially spiked five weeks ago, clearing trendline resistance (tracking the 200-day moving average) after the company’s quarterly results.
The subsequent pullback has been orderly, underpinned by the trendline, a bull-bear fulcrum detailed previously.
As the world’s largest company by market cap, Apple’s resilience marks a broad-market tailwind. The prevailing rally attempt is intact barring a violation of trendline support.
Finally, Amazon.com, Inc. (AMZN) is acting less well technically.
The shares initially turned lower five weeks ago, pressured after the company’s fourth-quarter results. The downdraft punctuated a bearish island reversal near the 200-day moving average.
More immediately, the shares have asserted a posture under the 50-day moving average, currently 95.20, a widely-tracked intermediate-term indicator.
Tactically, the 50-day has marked an inflection point going back as far as December 2021. A sustained reversal higher would strengthen the backdrop.


