Bearish momentum persists, Nasdaq challenges 200-day average
Focus: Dow industrials form bearish double top, S&P 500 retests key trendline
Technically speaking, the major U.S. benchmarks continue to grind lower, pressured toward headline technical tests to start March.
Amid the downturn, the S&P 500 is pressing its 200-day moving average, currently 3,940 — (an area matching trendline support) — while the Nasdaq Composite is also challenging its corresponding 200-day moving average, currently 11,405.
Tactically, these are widely-tracked longer-term trending indicators, and the pending retests may set the early-March technical tone.
Editor’s Note: As always, updates can be directly accessed at https://chartingmarkets.substack.com.
Before detailing the U.S. markets’ wider view, the S&P 500’s hourly chart highlights the past four weeks.
As illustrated, the S&P continues to trend broadly lower.
The prevailing downturn places it slightly under the 50-day moving average, currently 3,981.
Delving deeper, the more important 200-day moving average, currently 3,940, is firmly within view.
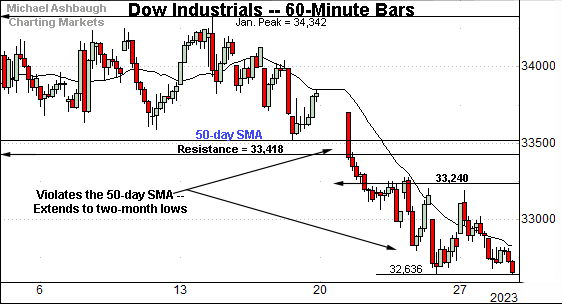
Meanwhile, the Dow Jones Industrial Average has extended a downturn, pulling in to tag two-month lows.
The recent range has been capped by familiar resistance (33,240) — detailed previously — an area also illustrated on the daily chart.
Slightly more broadly, the prevailing downturn originates from resistance matching the Jan. peak (34,342). The Feb. peak registered within eight points.
Against this backdrop, the Nasdaq Composite has also asserted a downtrend.
Tactically, the recent price action has been capped by the breakdown point (11,630).
Delving deeper, the prevailing downturn places the 200-day moving average, currently 11,405, firmly within view.
Widening the view to six months adds perspective.
On this wider view, the Nasdaq has edged under its breakout point (11,492), a familiar bull-bear fulcrum.
Separately, the prevailing downturn places the marquee 200-day moving average, currently 11,405, within view.
As detailed repeatedly, the Nasdaq’s backdrop broadly supports a bullish intermediate- to longer-term bias barring a violation of the 11,405-to-11,490 area. The next several sessions, to start March, will likely add color.
On further weakness, the ascending 50-day moving average, currently 11,212, closely matches deeper support (11,220).
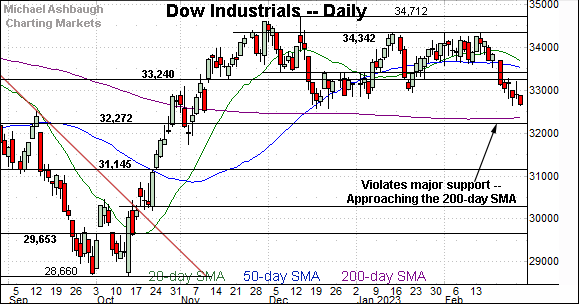
Looking elsewhere, the Dow Jones Industrial Average has tagged two-month lows.
Recall selling pressure accelerated amid last month’s violation of the 50-day moving average.
From current levels, the Dec. low (32,573) is followed by the marquee 200-day moving average, currently 32,358.
More broadly, the prevailing downturn punctuates a bearish double top, defined by the December and February peaks.
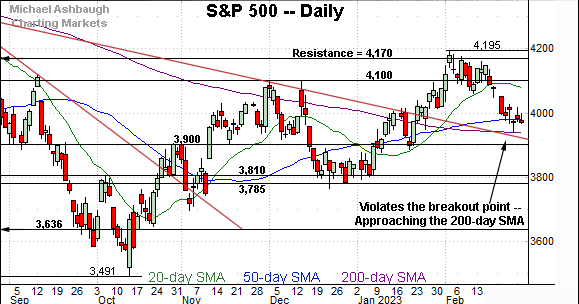
Meanwhile, the S&P 500 has tagged one-month lows.
Recall selling pressure accelerated amid last month’s violation of the breakout point (4,100).
More immediately, the S&P is approaching its 200-day moving average, currently 3,940, an area roughly matching trendline support.
The bigger picture
As detailed above, the major U.S. benchmarks continue to grind lower, pressured toward headline technical tests to start March.
Amid the downturn, two widely-tracked technical levels stand out:
The S&P 500’s 200-day moving average, currently 3,940.
The Nasdaq Composite’s 200-day moving average, currently 11,405.
As always, the 200-day moving average is a widely-tracked longer-term trending indicator. Both areas are currently under siege, as this is written, and the pending retests may be consequential.
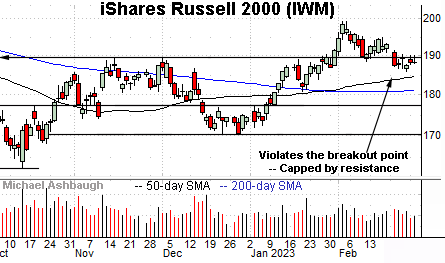
Moving to the small-caps, the iShares Russell 2000 ETF (IWM) is digesting a downturn from six-month highs.
Against this backdrop, the small-cap benchmark has violated its former breakout point (189.90) and subsequently observed this area as resistance.
Tactically, a sustained reversal atop the 190 area would signal waning bearish momentum.
Meanwhile, the SPDR S&P MidCap 400 ETF (MDY) remains comparably stronger.
In its case, the prevailing pullback from 11-month highs has been underpinned by the breakout point (475.15). At least so far.
Also recall the 50-day moving average, currently 467.40, marked a December inflection point, and is rising toward support.
Returning to the S&P 500, this next chart is a weekly view spanning 30 months. Each bar on the chart represents one week.
As illustrated, the S&P 500 has pulled in to test trendline support, a level hinged to the S&P’s all-time high established 14 months ago.
The prevailing downturn originates from major resistance (4,170), an area also detailed on the daily chart below.
Narrowing to the S&P 500’s six-month view adds perspective.
On this daily chart, the S&P has pulled in toward a potentially consequential technical test.
Specifically, the index is approaching its 200-day moving average, currently 3,940, a level closely followed by trendline support.
Against this backdrop, the late-February rally attempt — the initial lift from the 200-day moving average — registered as conspicuously flat, lacking upside follow-through. Shaky price action.
Tactically, a sustained violation of the 3,940 area would raise a technical red flag, signaling the early-year rally attempt may have run its course.
On further weakness, the 3,900 mark is followed by deeper support in the 3,785-to-3,810 area.
Beyond specific levels, the CBOE Volatility Index (VIX) has sustained a break atop its 50-day moving average, currently, 20.36, notching seven straight closes higher. So the prevailing sentiment backdrop is currently supportive of broad-market downside.
Separately, the 10-year Treasury note yield — detailed last week — has extended its breakout to start March, tagging the 4.00 mark. The yield has reached a higher plateau, an added broad-market headwind. No new setups today.
Also see Feb. 21: Charting a shaky technical tilt, S&P 500 violates the breakout point.
Editor’s Note: The next review will be published Tuesday, March 7.


