S&P 500 extends to uncharted territory as market rotation persists
Focus: Transports clear key trendline, Tesla sustains trendline breakout, TRAN, TSLA, SNOW, KLIC, NSC
U.S. stocks are slightly higher early Friday, rising as a slow-motion August rally persists.
Against this backdrop, the S&P 500 and Dow Jones Industrial Average have extended breaks to record territory, rising as the Nasdaq Composite consolidates, treading water amid market rotation.
Editor’s Note: As always, updates can be directly accessed at chartingmarkets.substack.com.
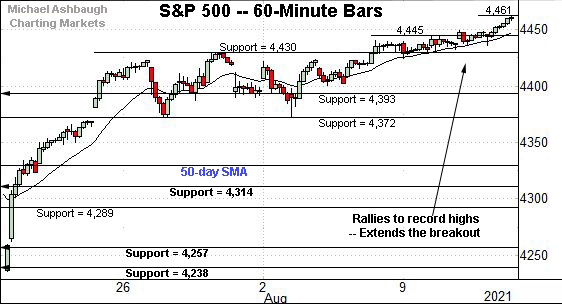
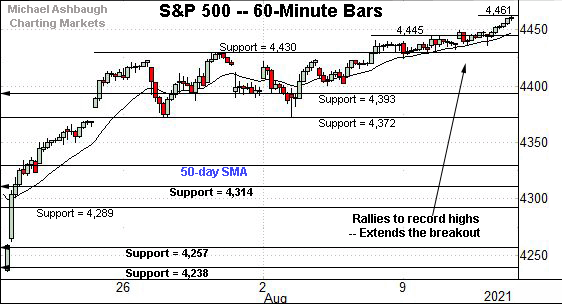
Before detailing the U.S. markets’ wider view, the S&P 500’s hourly chart highlights the past four weeks.
As illustrated, the S&P has extended its uptrend, rising to tag another record high.
The prevailing follow-through punctuates a flag pattern, the tight range underpinned by the former breakout point (4,430). Bullish price action.
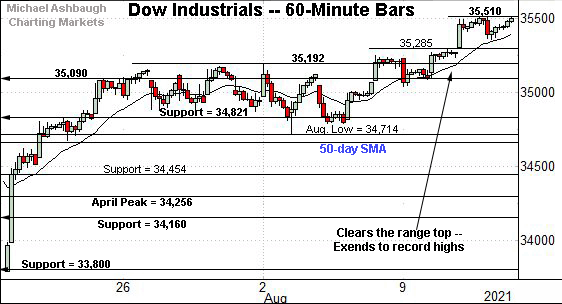
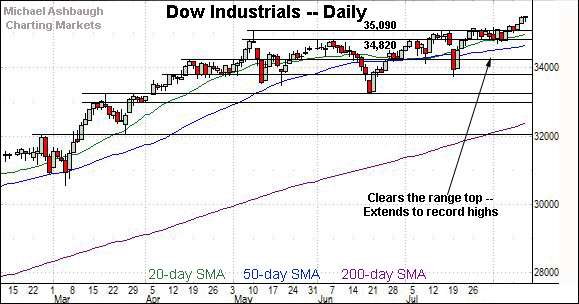
Similarly, the Dow Jones Industrial Average has broken out, reaching record territory.
Tactically, initial support matches the mid-week gap — the 35,285-to-35,300 area. (The bottom, and top, of the Dow’s small gap to record highs.)
Delving deeper, the former range top (35,192) is followed by the May peak (35,091).
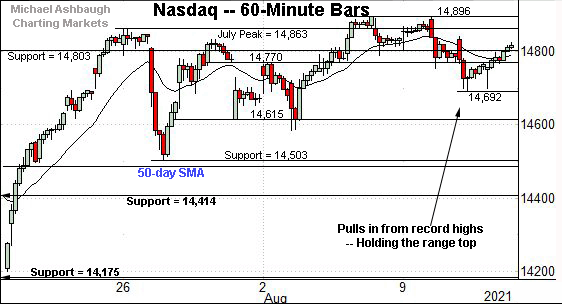
True to recent form, the Nasdaq Composite is lagging slightly behind.
Still, the index continues to largely hold its range top, treading water amid market rotation.
The week-to-date peak (14,894) has registered about two points under the Nasdaq’s record high (14,896) established last week.
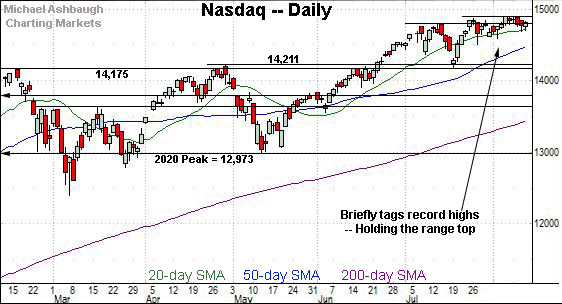
Widening the view to six months adds perspective.
On this wider view, the Nasdaq has pulled in modestly from its range top.
The prevailing three-week range — underpinned by the 20-day moving average — is hinged to the sharp mid-July rally from major support (14,175).
More broadly, the mid-June breakout resolved a double bottom defined by the March and May lows.
Looking elsewhere, the Dow Jones Industrial Average has finally registered a valid breakout, clearing the former range top by about a 1.2% margin.
The prevailing upturn marks the “expected” follow-through from the Dow’s formerly tight two-week range.
More broadly, the breakout punctuates an inverse head-and-shoulders pattern, defined by the May, June and July lows. Bullish price action.
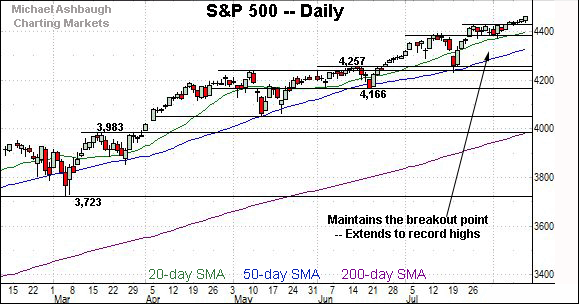
Meanwhile, the S&P 500’s comparably slow-motion breakout remains underway.
The prevailing upturn punctuates a flag-like pattern, underpinned by the former breakout point (4,393).
The bigger picture
Another day, another grind to record highs for at least one of the big three U.S. benchmarks.
That’s been the backdrop across about three weeks as a mid-summer rally persists.
Perhaps more usefully, the market price action remains rotational, as surging Treasury yields have contributed to the latest broad-market leg higher.
Against this backdrop, large-cap technology has been modestly pressured, as a source of funds deployed to other sectors, including the financials, detailed Wednesday.
(On a granular note, the 10-year Treasury note yield has tagged its 50- and 200-day moving averages amid distinctly technical price action this week.)
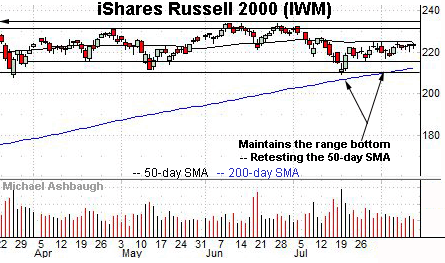
Moving to the small-caps, the iShares Russell 2000 ETF remains range-bound.
Within the range, the flatlining 50-day moving average, currently 224.60, remains an inflection point.
Meanwhile, the SPDR S&P MidCap 400 ETF has extended a slight break atop its 50-day moving average, currently 490.75. Record highs are increasingly within view.
Placing a finer point on the S&P 500, the index has extended its August breakout.
The prevailing follow-through punctuates a flag pattern, the tight range underpinned by the former breakout point (4,430).
More broadly, the breakout originates from familiar support (4,372). Recall the August low (4,373) registered nearby.
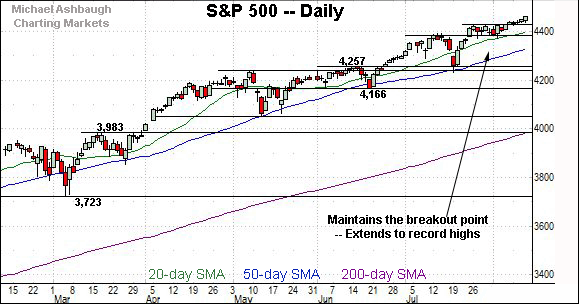
Returning to the six-month view, the S&P 500’s bigger-picture backdrop remains straightforward.
Tactically, near-term support points — at 4,430 and 4,372 — are followed by the ascending 50-day moving average, currently 4,332.
Delving deeper, likely last ditch-support matches the June breakout point (4,257). The July closing low (4,258) effectively matched support.
The S&P 500’s intermediate-term bias remains bullish barring a violation of this area.
Beyond technical levels, the bigger-picture backdrop continues to strengthen amid broadening participation, partly detailed in the next section.
Watch List
Drilling down further, the Dow Transports have come to life technically.
As illustrated, the group has cleared trendline resistance, rising to notch consecutive closes slightly atop the 50-day moving average, currently 14,807.
The breakout signals a trend shift.
Tactically, trendline support roughly matches the former breakdown point (14,475). The prevailing rally attempt is intact barring a violation.
More broadly, the transports’ resurgence exemplifies the still rotational sub-sector backdrop, strengthening the broad-market bull case.
Initially profiled July 30, Tesla, Inc. remains well positioned.
Late last month, the shares staged a strong-volume breakout, knifing atop trendline resistance after the company’s quarterly results.
The subsequent flag-like pattern — the tight August range — has formed amid decreased volume, positioning the shares to build on the initial spike.
Tactically, the prevailing range bottom (697.60) closely matches the breakout point. A sustained posture higher signals a bullish bias. Delving deeper, trendline support closely matches the major moving averages.
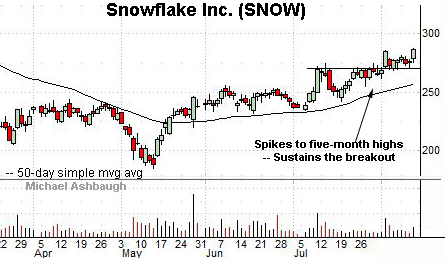
Public since September 2020, Snowflake, Inc. is a large-cap provider of data-warehousing and infrastructure-storage solutions.
Earlier this month, the shares knifed to five-month highs, clearing resistance matching the July peak.
The ensuing pullback has been flat — underpinned by the breakout point (272.00) — positioning the shares to extend the rally attempt.
Delving deeper, the 50-day moving average is rising toward support. The prevailing uptrend is intact barring a violation.
Note the company’s quarterly results are due out Aug. 25.
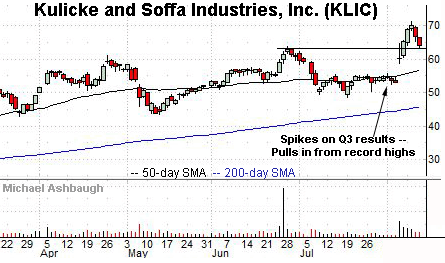
Kulicke & Soffa Industries, Inc. is a well positioned mid-cap chip equipment name.
Technically, the shares have recently knifed to record highs, rising amid a volume spike after the company’s strong quarterly results.
The subsequent pullback places the shares near the breakout point (63.05) and 11.1% under the August peak. Friday’s early session low (63.11) has closely matched support.
Finally, Norfolk Southern Corp. is a large-cap railroad operator coming to life. (Yield = 1.6%.)
As illustrated, the shares have tagged one-month highs, clearing trendline resistance amid a volume uptick.
Tactically, the breakout point (265.20) is closely followed by the 50-day moving average (264.15), a recent bull-bear inflection point. The prevailing rally attempt is intact barring a violation.
More broadly, the August trendline breakout punctuates a jagged test of the 200-day moving average.


