Charting (bullish) market rotation, S&P 500 sustains July breakout
Focus: Sector re-rotation surfaces, Tesla's breakout attempt, XHB, XME, XLB, XLF, TSLA, SNAP, NOK
U.S. stocks are lower early Friday, pressured at least partly amid concerns over Amazon’s disappointing quarterly results.
Nonetheless, the late-month selling pressure has registered amid otherwise constructive week-to-date price action, punctuated by broadening U.S. sector participation.
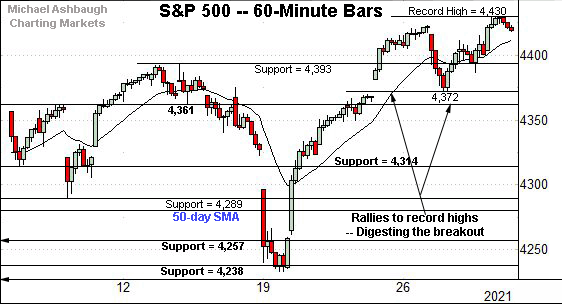
Before detailing the U.S. markets’ wider view, the S&P 500’s hourly chart highlights the past four weeks.
As illustrated, the S&P continues to digest its late-July break to record territory.
Tactically, the breakout (4,393) is followed by the week-to-date low (4,372).
Meanwhile, the Dow Jones Industrial Average is pressing its range top.
The index has twice this week tagged nominal record highs — Monday and Thursday — without truly breaking out. Still, the prevailing tight one-week range is technically constructive.
Tactically, the week-to-date low (34,877) is followed by the former range top (34,820), an area also detailed on the daily chart.
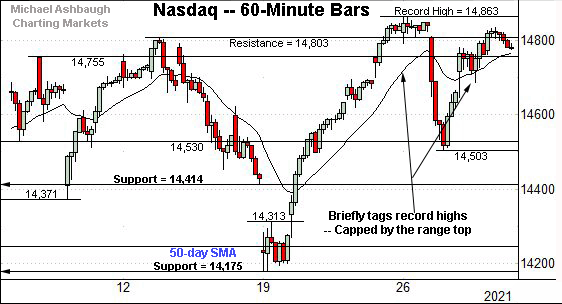
Against this backdrop, the Nasdaq Composite tagged a record high Monday, and has since pulled in to the range.
More broadly, the prevailing range is underpinned by major support (14,175) also illustrated below.
Recall last week’s low (14,178) — also the July low — registered nearby.
Widening the view to six months adds perspective.
On this wider view, the Nasdaq has rallied from its breakout point (14,175), rising to press record highs.
More immediately, the 20-day moving average, currently 14,645, has underpinned the late-July price action.
On further strength, a near- to intermediate-term target continues to project to the 15,420 area. (See the July 26 review.)
Looking elsewhere, the Dow Jones Industrial Average is also challenging record territory.
Tactically, recall the May peak (35,091) and mid-July peak (35,090) closely matched.
This area remains a sticking point, though the Dow ventured atop resistance both Monday and Thursday.
More broadly, the prevailing upturn punctuates a modified inverse head-and-shoulders pattern, defined by the May, June and July lows.
Recent persistent near the range top signals still muted selling pressure, improving the chances of eventual follow-through.
Meanwhile, the S&P 500 has sustained a slight break to record territory.
The prevailing flag pattern has been underpinned by the breakout point (4,393) on a closing basis. Bullish price action.
The bigger picture
As detailed above, the major U.S. benchmarks seem to be concluding July on a constructive note.
On a headline basis, the S&P 500 and Dow industrials tagged nominal record highs Thursday, rising amid broadening sector participation.
Meanwhile, the Nasdaq Composite has experienced late-month selling pressure, though the downturn is at least partly a function of healthy market rotation.
(Recall that narrowing sector leadership had presented a concern throughout July, a backdrop that may be self-correcting as August approaches. The U.S. sub-sector backdrop has strengthened in recent sessions.)
Moving to the small-caps, the iShares Russell 2000 ETF remains range-bound.
Within the range, an extended test of the 50-day moving average, currently 224.98, remains underway.
Meanwhile, the SPDR S&P MidCap 400 ETF has edged slightly atop its 50-day moving average, currently 490.70.
Combined, tandem small- and mid-cap follow-through atop the 50-day moving average would be consistent with broadening market participation.
Returning to the S&P 500, its six-month backdrop remains bullish.
Tactically, the prevailing bull flag — the tight one-week range — has been underpinned by the breakout point (4,393). Constructive price action.
Delving deeper, the 50-day moving average, currently 4,284, is followed by the breakout point (4,257) and the July low (4,233).
Tactically, the S&P’s intermediate-term bias remains comfortably bullish barring a violation of these areas.
Beyond technical levels, the S&P 500 has yet to confirm its uptrend with decisive follow-through.
Nonetheless, the bigger-picture backdrop has strengthened, on the margin, amid broadening sector participation, and rotational price action, partly detailed in the next section.
Watch List — Sector rotation resurfaces to conclude July
Drilling down further, the U.S. sub-sector backdrop has strengthened amid signs of healthy re-rotation as July concludes. Four groups exemplify the backdrop.
To start, the SPDR S&P Homebuilders ETF has broken out, reaching nearly two-month highs.
The strong-volume upturn punctuates a tight one-week range underpinned by the 50-day moving average.
More broadly, the upturn punctuates a double bottom — the W formation — defined by the June and July lows. Tactically, the breakout point (74.50) pivots to support.
Similarly, the SPDR S&P Metals and Mining ETF has come to life technically.
In the process, the group has reached six-week highs amid a strong-volume spike.
Tactically, the breakout point, circa 44.10, closely matches the 50-day moving average, currently 43.94.
Looking elsewhere, the Materials Select Sector SPDR has also turned higher. (Yield = 1.6%.)
As illustrated, the group has reached six-week highs, rising to retest the 50-day moving average, currently 83.80.
To be sure, the upturn has registered amid lackluster volume — unlike the prior groups — presenting the risk of a false breakout, resembling the mid-July shakeout briefly below the range. Follow-through atop the 50-day moving average would strengthen the bull case.
Tactically, the breakout point — the 83.25-to-83.50 area — pivots to support.
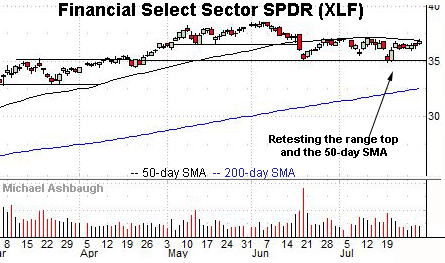
Meanwhile, the Financial Select Sector SPDR remains range-bound. (Yield = 1.6%.)
Still, the group is pressing its 50-day moving average, currently 36.90, a level roughly matching the range top (37.14).
The prevailing upturn punctuates a tight seven-session range, laying the groundwork for potentially decisive follow-through. Tactically, a breakout attempt is in play barring a violation of the range bottom (36.00).
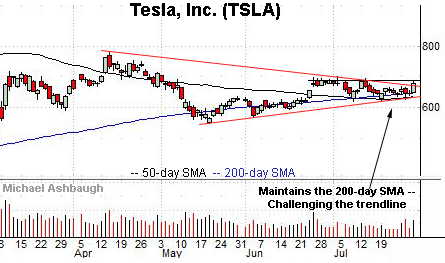
Moving to specific names, Tesla, Inc. is showing signs of life, rising amid a delayed reaction to the company’s strong quarterly results, released earlier this week.
(Separately, rival Ford Motor Co. indicated late Wednesday it sees signs of the global chip shortage easing, a potential positive for Tesla as well.)
Against this backdrop, the shares are challenging trendline resistance roughly matching a five-week range top. Resistance broadly spans from 685.70 to 700.00.
The prevailing upturn has been fueled by a volume uptick — and punctuates a tight July range — laying the groundwork for potentially decisive follow-through.
Tactically, trendline support closely matches the 50- and 200-day moving averages, circa 648.50. A breakout attempt is in play barring a violation of the 200-day, currently 648.50.
Snap, Inc. is a well positioned large-cap name.
Earlier this month, the shares gapped to all-time highs, rising after the company’s quarterly results.
The ensuing pullback has been flat, placing the shares near gap support (74.00) and 5.6% under the July peak.
Delving deeper, the post-breakout low (71.80) is followed by the former range top (70.25). A sustained posture higher signals a bullish bias.
Finally, Nokia Corp. — initially profiled July 16 — has extended its uptrend.
As illustrated, the shares have gapped to six-month highs, rising after the company’s second-quarter results. Tactically, the top of the gap (6.02) closely matches the breakout point.
Delving deeper, consider that the mid-July low (5.53) closely matched key gap support (5.47), detailed previously.


