Bullish momentum persists, S&P 500 grinds to latest record high
Focus: Financials challenge record territory, Materials sector extends breakout, Steel comes to life on infrastructure bill, XLF, XLB, NUE, CLF, LSPD, DDOG
U.S. stocks are mixed early Wednesday, vacillating after tamer-than-feared inflation data, and amid optimism over the U.S. Senate’s passage of a widely-anticipated infrastructure bill.
Against this backdrop, the S&P 500 and Dow Jones Industrial Average have rallied to tag their latest record highs.
Editor’s Note: As always, updates can be directly accessed at chartingmarkets.substack.com.
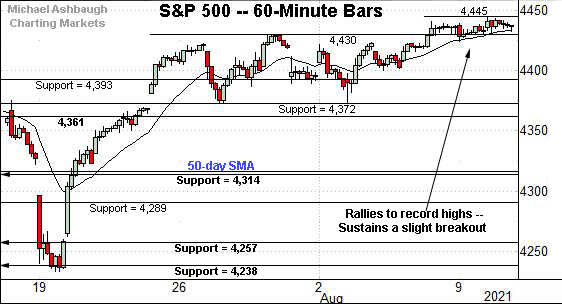
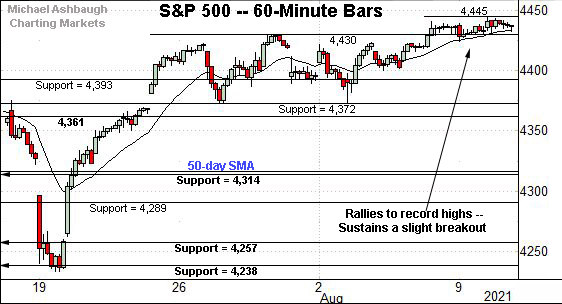
Before detailing the U.S. markets’ wider view, the S&P 500’s hourly chart highlights the past four weeks.
As illustrated, the S&P has sustained a modest break to record territory.
Tactically, the breakout point (4,430) is followed by a firmer floor matching the former range bottom (4,372).
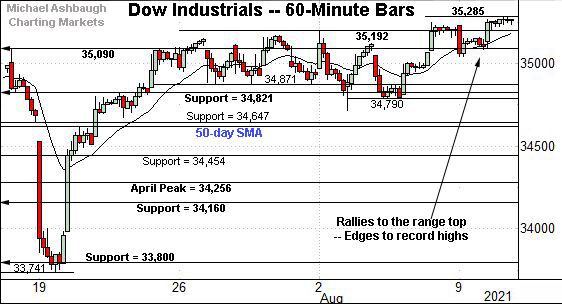
Similarly, the Dow Jones Industrial Average has tagged a nominal record high.
The prevailing upturn punctuates a nearly three-week range.
Tactically, a familiar floor matches the May peak (35,091), an area also detailed on the daily chart.
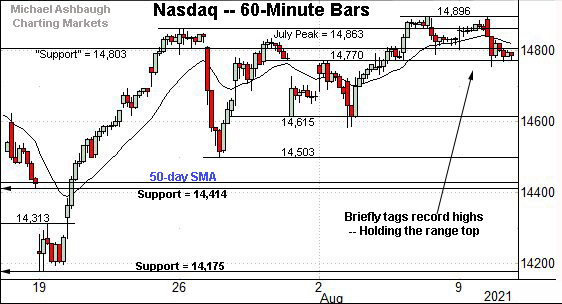
Against this backdrop, the Nasdaq Composite is holding its range top.
Consider that Tuesday’s session high (14,894) missed the Nasdaq’s record high (14,896) by about two points.
Still, the relatively shallow pullback from record highs is technically constructive.
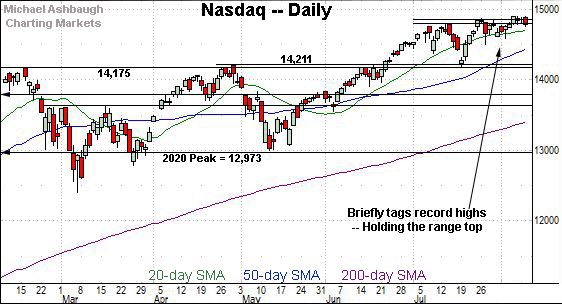
Widening the view to six months adds perspective.
On this wider view, the Nasdaq continues to press its range top.
The prevailing upturn punctuates a relatively tight two-week range, hinged to the mid-July spike from major support (14,175).
Also recall the mid-June breakout resolved a double bottom defined by the March and May lows. A near- to intermediate-term target continues to project to the 15,420 area.
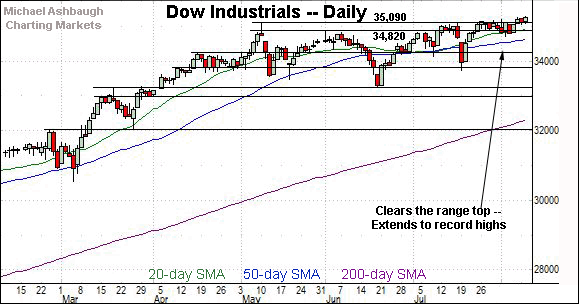
Looking elsewhere, the Dow Jones Industrial Average has slightly extended its August breakout.
The prevailing upturn punctuates a tight two-week range — a coiled spring — laying the groundwork for potentially more decisive follow-through.
More broadly, the prevailing upturn punctuates an inverse head-and-shoulders pattern, defined by the May, June and July lows. The Dow’s backdrop remains broadly bullish.
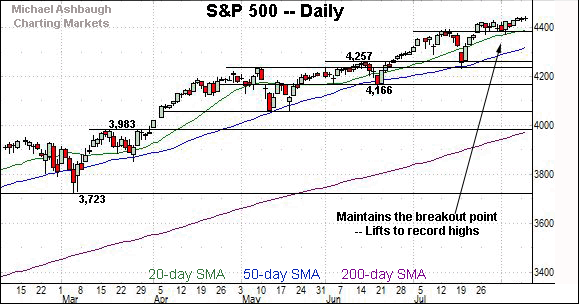
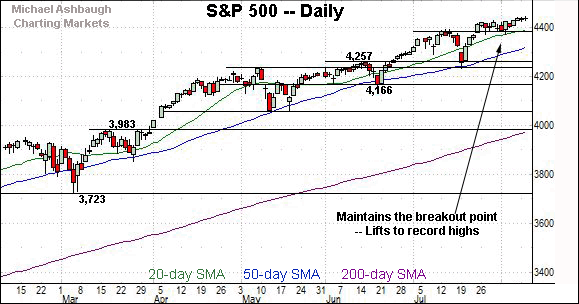
Meanwhile, the S&P 500 continues to tag record highs in grinding-higher form.
The prevailing upturn punctuates a flag-like pattern, underpinned by the former breakout point (4,393).
The bigger picture
As detailed above, the major U.S. benchmarks are acting well technically.
On a headline basis, the S&P 500 and Dow industrials have edged to record highs this week.
Meanwhile, the Nasdaq Composite has pulled in modestly, pressured after missing a record high Tuesday by less than two points.
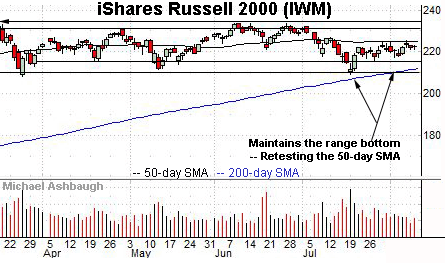
Moving to the small-caps, the iShares Russell 2000 ETF remains range-bound.
Within the range, the flatlining 50-day moving average, currently 224.72, remains an inflection point.
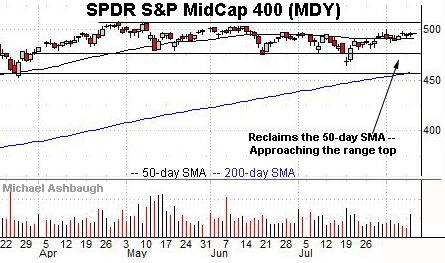
Meanwhile, the SPDR S&P MidCap 400 ETF continues to flatline slightly atop its 50-day moving average, currently 490.56.
Placing a finer point on the S&P 500, the index has sustained a modest break to record territory.
Recall a near-term target projects from the former range to the 4,488 area.
More broadly, the S&P 500’s grinding-higher August upturn punctuates a bullish continuation pattern.
On further strength, more distant intermediate-term targets continue to project from the July range to the 4,510 and 4,553 areas.
Conversely, near-term support points — at 4,393 and 4,372 — are followed by the ascending 50-day moving average, currently 4,321.
Delving deeper, likely last ditch-support matches the June breakout point (4,257). The July closing low (4,258) effectively matched support.
Tactically, the S&P’s intermediate-term bias remains bullish to the extent it maintains a posture atop this area.
Beyond technical levels, the August price action remains rotational, amid broadening participation, strengthening the bull case.
Watch List
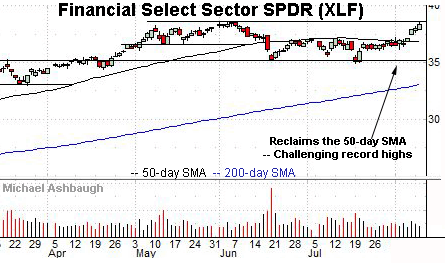
Drilling down further, the Financial Select Sector SPDR — profiled last week — has extended its rally attempt. (Yield = 1.6%.)
In the process, the group has rallied to the range top, rising to challenge its record high (38.60), established two months ago.
Recall the August upturn punctuates a tight two-week range, laying the groundwork for the group’s relatively decisive follow-through.
More immediately, the group has tagged a fractional new record high early Wednesday. On further strength, an intermediate-term target projects to the 42.00 area.
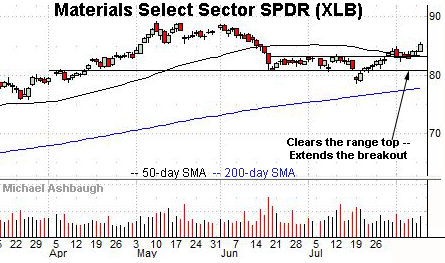
Looking elsewhere, the Materials Select Sector SPDR has also come to life technically. (Yield = 1.6%.)
As illustrated, the group has sustained its late-July breakout, extending to seven-week highs.
Tactically, the breakout point (83.25) closely matches the 50-day moving average, currently 83.32. A sustained posture higher signals a bullish bias.
More broadly, the groups detailed — the materials and financials — exemplify the recently broadening sector participation, detailed repeatedly. (See for instance, the July 30 review.)
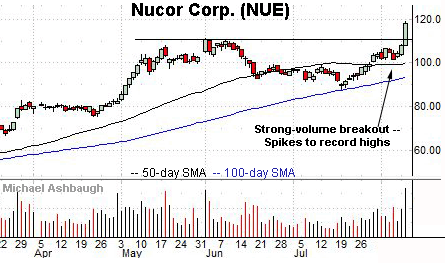
Nucor Corp. is a well positioned large-cap steel producer. (Yield = 1.4%)
Technically, the shares have knifed to record highs, rising after the U.S. Senate approved a $1.2 trillion infrastructure bill.
Though near-term extended, and due to consolidate, the strong-volume spike is longer-term bullish. Tactically, a sustained posture atop the breakout point (110.74) signals a bullish bias.
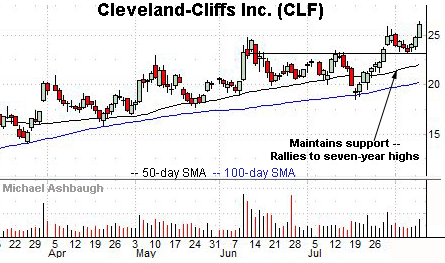
Initially profiled Aug. 6, Cleveland-Cliffs, Inc. has added 8.3% and remains well positioned.
As illustrated, the shares have staged a bull-flag breakout, tagging record highs on increased volume.
Tactically, the former range top, circa 25.20, pivots to near-term support.
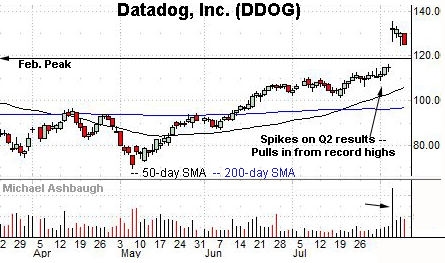
Public since October 2019, Datadog, Inc. is a large-cap provider of monitoring and security software solutions for cloud-based applications.
Earlier this month, the shares gapped to record highs, rising after the company’s strong quarterly results.
The subsequent pullback has been fueled by decreased volume, placing the shares 8.0% under the August peak.
Tactically, the breakout point (119.40) is followed by the bottom of the gap (116.40). The prevailing rally attempt is intact barring a violation.
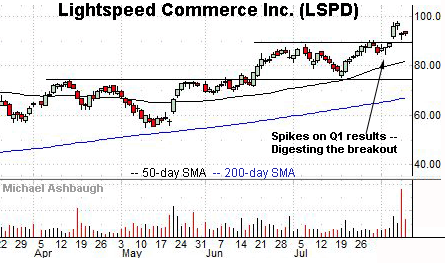
Public since August 2019, Lightspeed Commerce, Inc. is a large-cap developer of software-as-a-service solutions.
Technically, the shares have recently knifed to record highs, rising after the company’s first-quarter results.
The ensuing pullback places the shares 5.1% under the August peak.
Tactically, gap support (89.30) closely matches the breakout point. Conversely, an intermediate-term target projects to just under the 100 mark.


