S&P 500 extends breakout amid sector rotation
Focus: Sector participation broadens amid rotation, Amazon clears key resistance, TRAN, KIE, XME, XBI, AMZN
Technically speaking, the major U.S. benchmarks are concluding a highly-volatile first quarter with a massive late-March rally.
Against this backdrop, the S&P 500 has reached two-month highs, rising amid respectable market breadth, and healthy sub-sector rotation.
Editor’s Note: As always, updates can be directly accessed at https://chartingmarkets.substack.com.
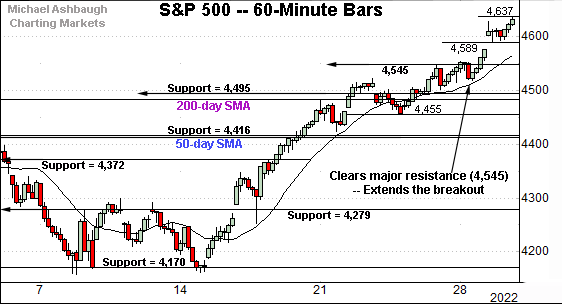
Before detailing the U.S. markets’ wider view, the S&P 500’s hourly chart highlights the past four weeks.
As illustrated, the S&P has extended its March rally, placing distance atop major resistance (4,545).
From bottom to top, the prevailing upturn spans 476 points, or 11.4%, across just 12 sessions.
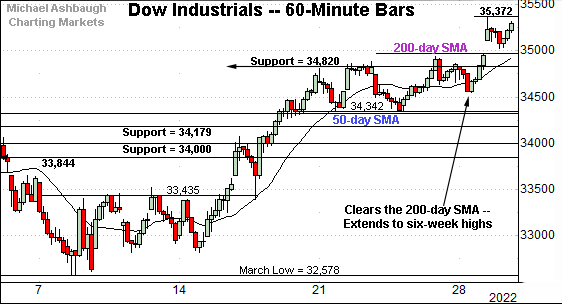
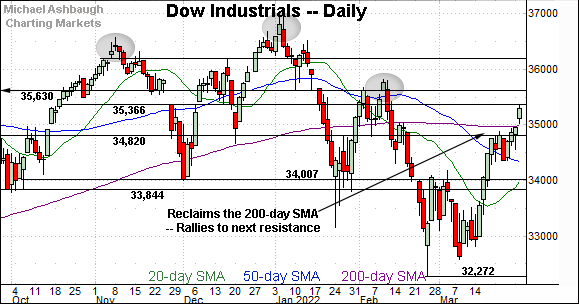
Meanwhile, the Dow Jones Industrial Average has reclaimed its 200-day moving average, a widely-tracked longer-term trending indicator.
From bottom to top, its upturn spans 2,794 points, or 8.6%, across 16 sessions.
Notably, the rally has thus far topped near major resistance (35,366) an area detailed on the daily chart. The week-to-date peak (35,372) has registered nearby.
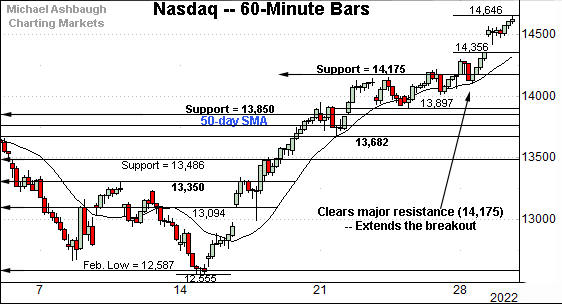
Against this backdrop, the Nasdaq Composite has also extended its breakout.
Recent follow-through places the index firmly atop major resistance (14,175), an area that pivots to support. (Recall last week’s close (14,169) registered nearby.)
From bottom to top, the prevailing upturn spans 2,091 points, or 16.7%, across just 12 sessions.
Combined, each major benchmark has staged a bull-flag breakout, of sorts, rising sharply from last week’s comparably tight range.
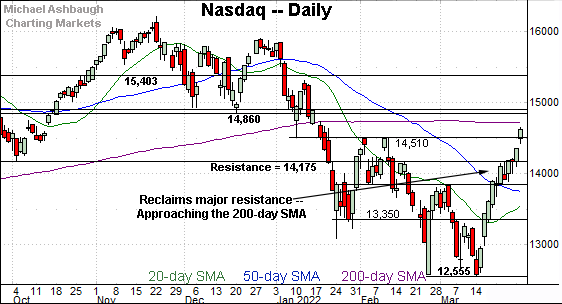
Widening the view to six months adds perspective.
On this wider view, the Nasdaq has knifed to two-month highs, rising within view of the marquee 200-day moving average, currently 14,729.
Tactically, the former range top (14,509) is followed by major support (14,175) and the mid-March breakout point, circa 13,850. The Nasdaq’s intermediate-term bias remains bullish barring a violation.
Separately, the Nasdaq has registered “higher highs” versus the early-March peak, and the February peak, also consistent with a trend shift.
Looking elsewhere, the Dow Jones Industrial Average has knifed to six-week highs.
The aggressive March rally has thus far topped at major resistance (35,366) an area detailed repeatedly.
The week-to-date peak (35,372) — and Wednesday’s early session high (35,361) — have registered nearby.
Tactically, the 200-day moving average, currrently 34,988, is followed by major support (34,820).
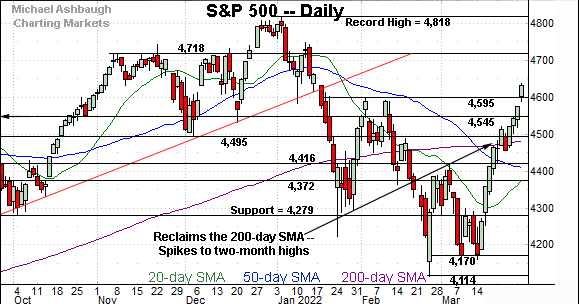
Meanwhile, the S&P 500 has knifed to two-month highs.
The nearly straightline March spike places it firmly atop the 200-day moving average.
The bigger picture
As detailed above, the major U.S. benchmarks seem poised to conclude the first quarter (ending March) with a massive bullish reversal.
The aggressive rally has cleared all kinds of technical resistance, amid respectable market breadth, and healthy sub-sector rotation.
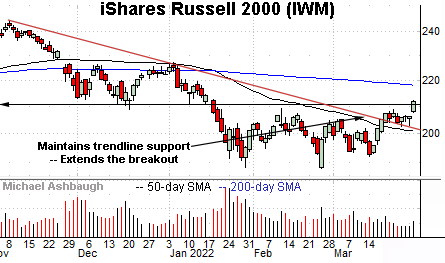
Moving to the small-caps, the iShares Russell 2000 ETF has extended its rally attempt.
The prevailing upturn punctuates a succcessful test of trendline support, and has been fueled by a volume uptick.
Tactically, a retest of the breakdown point (211.10) remains underway.
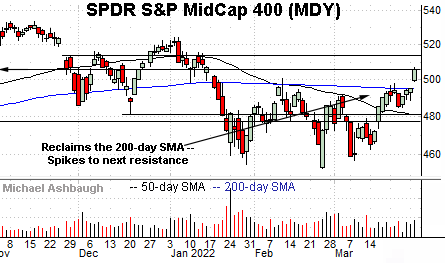
Meanwhile, the SPDR S&P MidCap 400 ETF remains comparably stronger.
As illustrated, the MDY has knifed atop its 200-day moving average, currently 495.25. This area closely matches the breakout point, and pivots to support.
Conversely, an extended test of next resistance, circa 506, remains in play.
More broadly, the S&P MidCap 400 and the Dow industrials have concurrently reclaimed the 200-day moving average.
Returning to the S&P 500, its bigger-picture backdrop remains relatively straightforward.
On a headline basis, the S&P has staged a massive 12-session spike, spanning as much as 476 points, or 11.4%.
Though near-term extended, and due to consolidate, the directionally sharp rally is likely bullish for the intermediate-term. (But interestingly, the steep rally has not marked a two standard deviation breakout, a function of the highly-volatile 2022 backdrop.)
Tactically, the breakout point (4,595) is followed by major support (4,545), an area detailed previously. Recall last week’s high (4,546) matched support.
Delving deeper, a more important floor spans from the 200-day moving average, currently 4,482, to former support (4,495) matching the December low.
Broadly speaking, the 4,482-to-4,495 area pivots to major support. The S&P 500’s rally attempt is intact — and its backdrop supports a bullish intermediate-term bias — barring a violation.
Beyond specific levels, the March rally has been fueled by respectable market breadth, as well as healthy sub-sector rotation, partly detailed in the next section.
Watch List
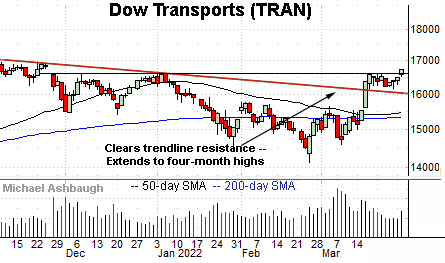
Drilling down further, the Dow Transports (TRAN) are acting well technically.
The group initially spiked two weeks ago, knifing atop trendline resistance and the major moving averages.
The subsequent flag-like pattern — (the tight range) — formed amid decreased volume, and has been punctuated by upside follow-through. Bullish price action.
Tactically, the breakout point (16,580) is followed by the post-breakout low (16,150). A sustained posture higher signals a bullish bias.
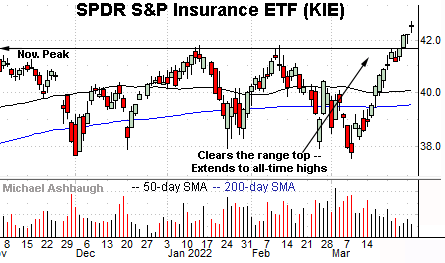
Meanwhile, the SPDR S&P Insurance ETF (KIE) has knifed to all-time highs. (Yield = 1.8%.)
The prevailing upturn punctuates a triple bottom defined by the November, January and March lows.
Though near-term extended, and due to consoliate, the unusually steep March rally is longer-term bullish. Tactically, the breakout point (41.70) pivots to support.
More broadly, the prevailing upturn punctuates a prolonged 11-month range — illustrated on the five-year chart — laying the groundwork for potentially material longer-term upside.
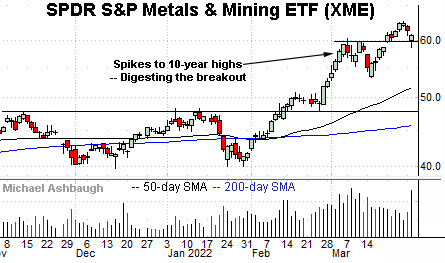
Looking elsewhere, the SPDR S&P Metals & Mining ETF (XME) continues to act well technically.
The group initially spiked four weeks ago, knifing to 10-year highs amid a sustained volume increase.
More immediately, the mid-March follow-through has been punctuated by an orderly pullback, underpinned by the breakout point (59.70).
(On a granular note, the prevailing pullback has almost precisely filled the mid-March gap. The week-to-date low (58.63) matched gap support (58.64).)
Recent follow-through punctuates a prolonged 11-month range, illustrated on the five-year chart. (Also see the March 11 review.)
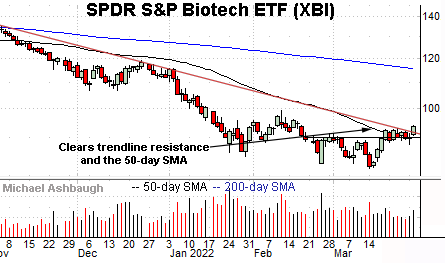
Scaling down in strength, the SPDR S&P Biotech ETF (XBI) is a lagging sector showing signs of life.
As illustrated, the group has cleared trendline resistance roughly tracking the 50-day moving average.
The slight breakout has been fueled by a volume uptick, and punctuates a flag-like pattern hinged to the steep mid-March rally.
Tactically, trendline support is followed by the former range bottom (78.75). The group’s recovery attempt is intact barring a violation.
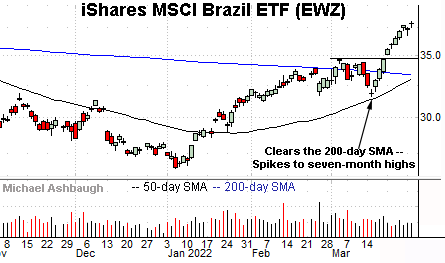
Beyond the U.S., the iShares MSCI Brazil ETF (EWZ) has taken flight, placing distance atop the 200-day moving average.
Though still near-term extended, the directionally sharp rally is longer-term bullish. Tactically, initial support (36.80) is followed by the firmer breakout point (34.75).
More broadly, notice the pending golden cross — or bullish 50-day/200-day moving average crosssover — an event that will likely signal this week.
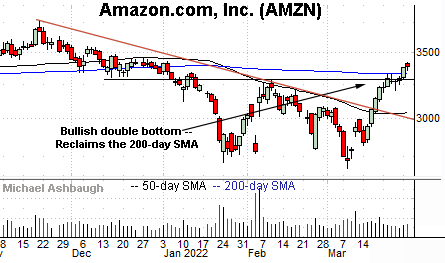
Finally, Amazon.com (AMZN) has staged a noteworthy breakout.
The shares initially spiked two weeks ago, clearing trendline resistance tracking the 50-day moving average.
The subsequent follow-through places the shares atop the 200-day moving average, currently 3,331, to punctuate a double bottom defined by the January and March lows.
Tactically, the breakout point (3,273) pivots to support. Amazon’s rally attempt is intact barring a violation.


