S&P 500 clears trendline resistance, rises to challenge 50-day average
Focus: Major U.S. benchmarks stage trendline breakouts, Nasdaq nails major resistance, Market breadth remains a question mark
Technically speaking, the major U.S. benchmarks have extended a bullish reversal from the October low.
In the process, each big three U.S. benchmark has cleared a key trendline, rising sharply from major support. Tactically, the October rally attempt is intact barring a violation of major support detailed below:
Editor’s Note: As always, updates can be directly accessed at https://chartingmarkets.substack.com.
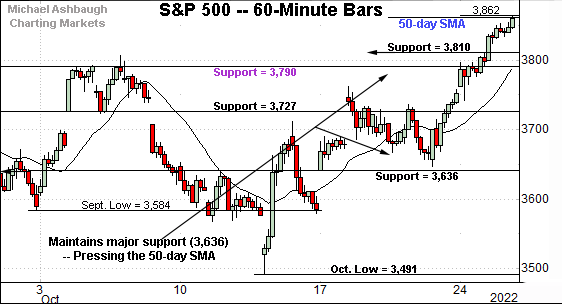
Before detailing the U.S. markets’ wider view, the S&P 500’s hourly chart highlights the past four weeks.
As illustrated, the S&P has tagged one-month highs.
The prevailing upturn places the 50-day moving average, currently 3,860, under siege.
Conversely, the breakout point (3,790) pivots to support, an area established after the Federal Reserve’s most recent policy statement.
Delving deeper, the prevailing upturn originates from familiar support (3,636), an area also detailed on the daily chart.
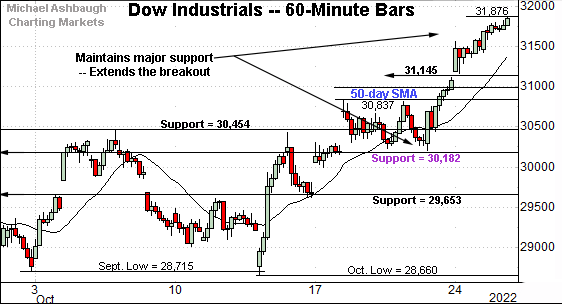
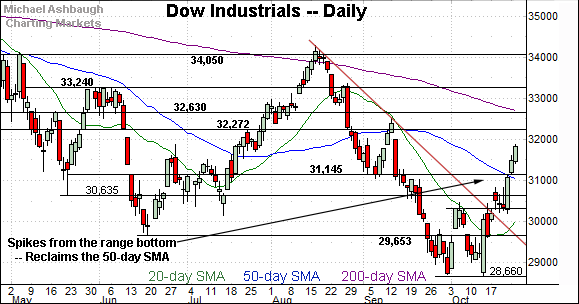
Meanwhile, the Dow Jones Industrial Average continues to outpace the other benchmarks.
In its case, the blue-chip benchmark has knifed to six-week highs, placing distance atop the 50-day moving average, currently 30,997.
The prevailing upturn punctuates a flag-like pattern, the tight range, underpinned by major support (30,182).
As detailed previously, the sharp rally off the October low, and subsequent flat pullback, is technically constructive.
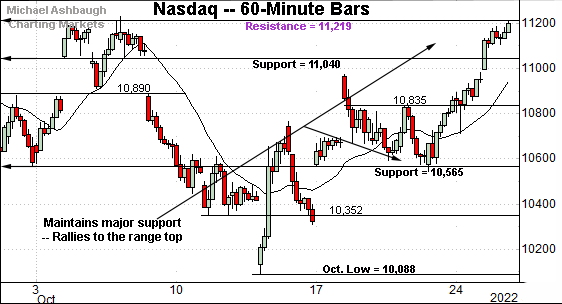
Against this backdrop, the Nasdaq Composite continues to underperform the other benchmarks.
Still, the index has knifed to its range top, rising to challenge major resistance (11,219) detailed previously.
The week-to-date peak (11,210) has registered nearby.
And here again, the prevailing upturn originates from major support (10,565) an area also illustrated below.
(Recall Nasdaq 10,565 corresponds with S&P 3,636, areas that have underpinned the prevailing rally attempt.)
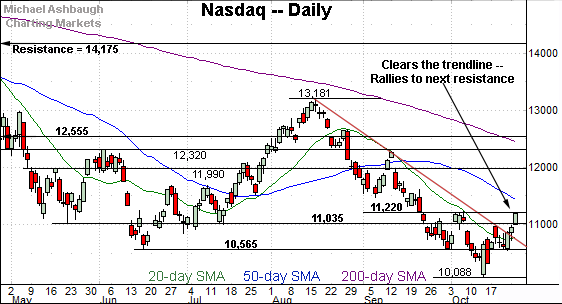
Widening the view to six months adds perspective.
On this wider view, the Nasdaq has staged a trendline breakout.
The prevailing upturn places familiar resistance (11,220) under siege, a level established immediately after the Fed’s most recent policy statement. (Also see the hourly chart.)
To reiterate, the week-to-date peak (11,210) has roughly matched resistance, and selling pressure has surfaced. Follow-through atop this area would mark a “higher high” confirming the October trend shift.
Also recall the trendline breakout originates from the former breakdown point (10,565), an area also detailed on the hourly chart.
Looking elsewhere, the Dow Jones Industrial Average has followed through much more aggressively, knifing to six-week highs.
The prevailing upturn builds on a mid-October trendline breakout.
Tactically, gap support (31,145) is followed by the 50-day moving average. A sustained posture atop this area signals a bullish intermediate-term bias.
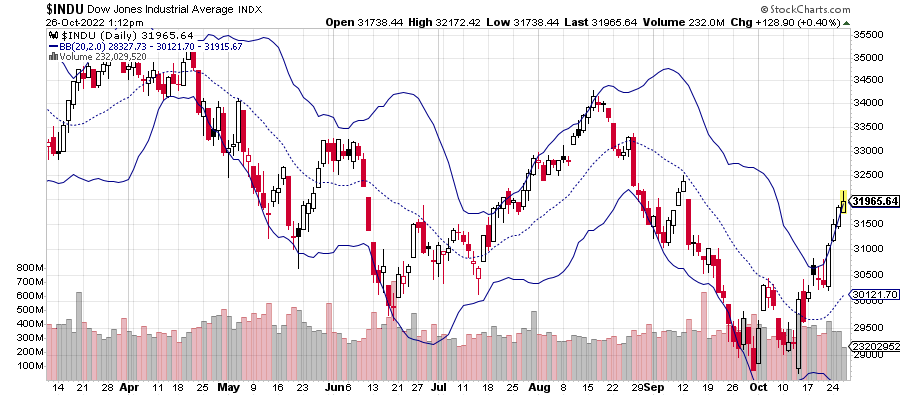
(On a granular note, the Dow industrials’ chart below includes the 20-day Bollinger bands, levels encompassing two standard deviations of the Dow’s trailing 20-day volatility:
As illustrated, the October spike marks an unsually bullish two standard deviation breakout, encompassing three straight closes atop the 20-day Bollinger bands. As always, consecutive closes atop the bands signal a near-term extended posture — due a cooling-off period — amid a bullish intermediate-term outlook. An important caveat here is that the Dow Jones Industrial Average is the least representative major U.S. benchmark, and it has outpaced the other major benchmarks.)
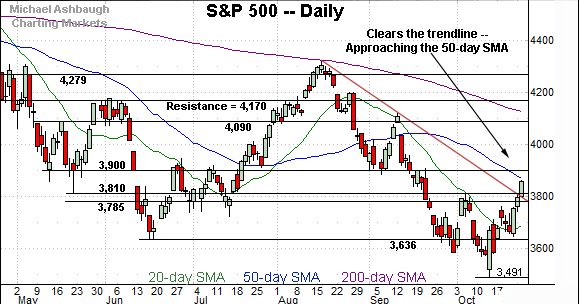
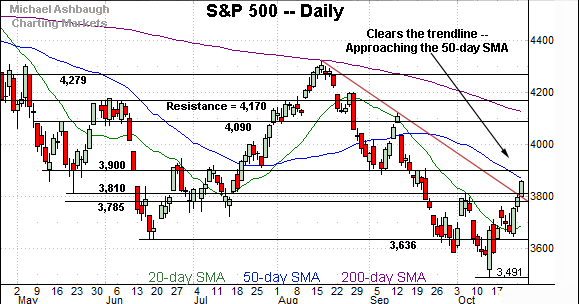
Meanwhile, the S&P 500 has staged a more recent trendline breakout.
The prevailing upturn places the 50-day moving average, currently 3,860, under siege.
Tactically, the 3,785-to-3,810 area pivots to major support. The prevailing rally attempt is intact barring a violation. (This area matches the second-quarter close (3,785), the recent Fed-induced level (3,790), the May low (3,810), and a former downside projected target.)
The bigger picture
As detailed above, the major U.S. benchmarks have extended a bullish reversal from the October low.
In the process, each big three benchmark has staged a trendline breakout, rising sharply from major support. (See the trendlines on the daily charts, and major support on the hourly charts.)
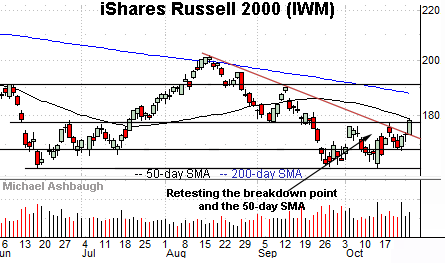
Moving to the small-caps, the iShares Russell 2000 ETF (IWM) is also showing signs of life.
As illustrated, the small-cap benchmark has cleared a key trendline, rising to challenge the breakdown point (177.50) and the 50-day moving average, currently 178.24.
The prevailing upturn originates from tandem volume spikes. Tactically, the prevailing rally attempt is intact barring a violation of the trendline, circa 173.00.
Conversely, sustained follow-through atop the breakdown point (177.50) would punctuate a “higher high” incrementally strengthening the intermediate-term bull case.
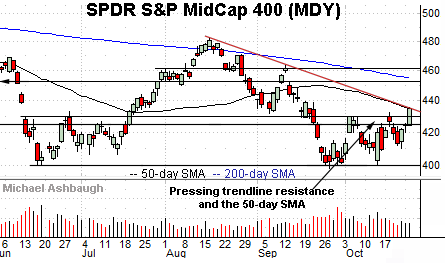
Meanwhile, the SPDR S&P MidCap 400 ETF (MDY) has reached a headline technical test.
Specifically, the mid-cap benchmark is challenging trendline resistance closely tracking the 50-day moving average, currently 433.70.
Against this backdrop, the prevailing upturn punctuates a double bottom, defined by the September and October lows. Tactically, the breakout point (429.70) pivots to notable support.
More broadly, recall the small- and mid-cap benchmarks stabilized before the major benchmarks, as detailed previously.
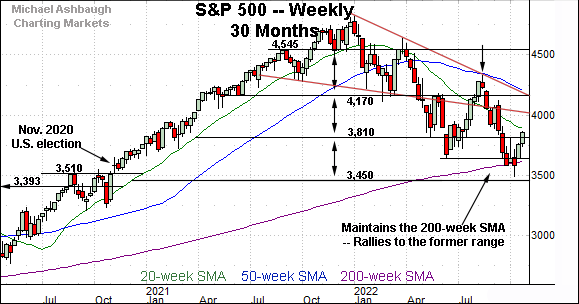
Returning to the S&P 500, this next chart is a weekly view spanning 30 months. Each bar on the chart represents one week.
As illustrated, the S&P has weathered a jagged test of the 200-week moving average, currently 3,613.
Moreover, the prevailing upturn places it atop major resistance (3,810), an area detailed repeatedly. (Consider that Monday’s session high (3,810) precisely matched resistance.)
Slightly more broadly, the October upturn originates from the election-fueled breakout point (3,510) detailed above. The S&P 500 has rallied as much as 10.6% from the October low.
Market breadth remains a question mark
Beyond the charts, the October rally attempt continues to get mixed marks for style.
To be sure, the prevailing upturn has encompassed a 13-to-1 up day — NYSE advancing volume surpassed declining volume by a 13-to-1 margin on Oct. 17 — though a comparable follow-through session has not yet registered.
As always, in a textbook world, two 9-to-1 up days — across about a seven-session window — would more reliably raise the flag to a major trend shift.
Returning to the six-month view, the S&P 500 has extended a respectable October rally attempt.
In the process, the index has cleared trendline resistance, an area matching several key technical levels.
As detailed previously, the 3,785-to-3,810 area pivots to major support. The prevailing rally attempt is intact barring a violation.
Conversely, on further strength, the 50-day moving average, currently 3,860, is followed by major resistance matching the 3,900 mark. Tactically, follow-through atop the 3,900 area would confirm the October trend shift, strengthening the bull case.
Beyond near- to intermediate-term issues, the S&P 500’s bigger-picture backdrop remains bearish pending more extensive repairs.
Editor’s Note: The next review will be published Tuesday, Nov. 1.
Also see Oct. 20: Charting a bear-market rally, S&P 500 sustains October bounce.


