Charting bullish follow-through, Nasdaq clears key trendline
Focus: Gold reclaims 200-day average, Gold miners confirm primary trend shift, GLD, GDX, KSS, IGT, FNKO
U.S. stocks are mixed early Tuesday, vacillating as the recently-weak technology sector shows signs of stabilizing.
Against this backdrop, the Nasdaq Composite has reclaimed trendline resistance, building on last week’s aggressive 8-to-1 bullish reversal from the May low.
Editor’s Note: As always, updates can be directly accessed at chartingmarkets.substack.com. Your smartphone can also access updates at the same address, chartingmarkets.substack.com.
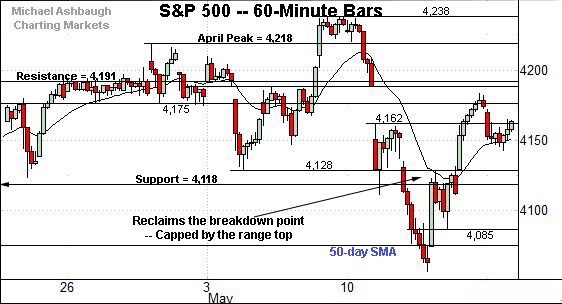
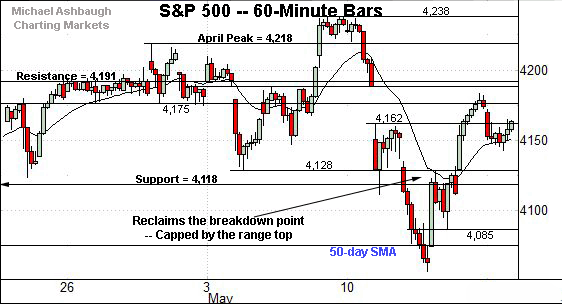
Before detailing the U.S. markets’ wider view, the S&P 500’s hourly chart highlights the past four weeks.
As illustrated, the S&P is traversing a relatively familiar range. The prevailing upturn punctuates last week’s successful test of the 50-day moving average.
Slightly more broadly, recall the S&P’s range formerly spanned precisely 100 points, from 4,118 to 4,218.
The index has tried to break higher, and lower, in recent weeks, thus far concluding with a bull-bear stalemate.
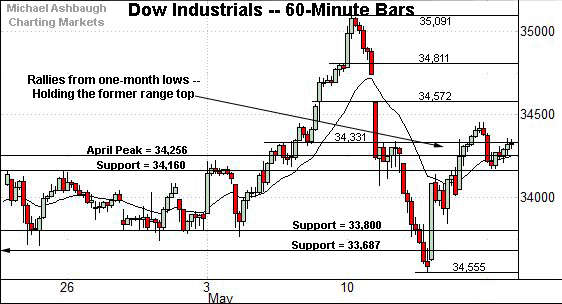
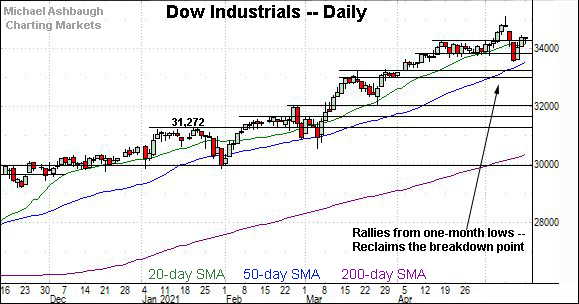
Meanwhile, the Dow Jones Industrial Average has sustained a rally back atop its former range.
Consider that Monday’s session low (34,176) registered slightly above familiar support (34,160) amid a successful retest.
The session close (34,327) roughly matched near-term resistance (34,331) detailed previously. Constructive price action.
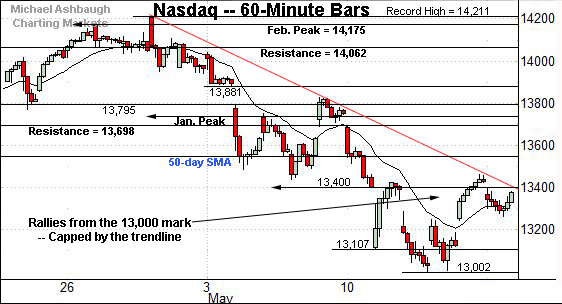
Against this backdrop, the Nasdaq Composite remains the weakest major benchmark.
Nonetheless, the index is pressing key trendline resistance.
In fact, the Nasdaq has ventured comfortably atop the trendline, circa 13,400, early Tuesday.
The prevailing upturn builds on Friday’s aggressive bullish reversal — fueled by 8-to-1 positive breadth — detailed previously.
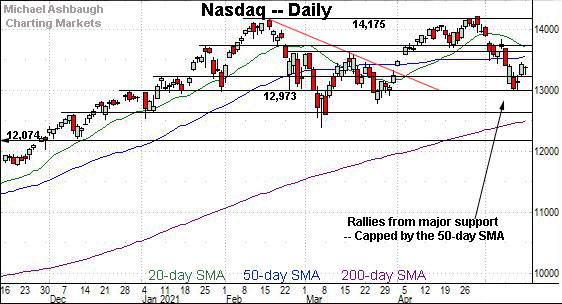
Widening the view to six months adds perspective.
On this wider view, the Nasdaq has sustained its bullish reversal from the 13,000 mark.
Tactically, overhead inflection points match the 50-day moving average, currently 13,566, and the March peak (13,620).
Follow-through atop resistance would signal waning bearish momentum, raising the flag to a potential shift in the intermediate-term bias. The pending retest from underneath will likely add color.
Recall the prevailing upturn originates from a successful test of the 13,000 mark, fueled by unusually strong 8-to-1 positive breadth.
Looking elsewhere, the Dow Jones Industrial Average has sustained a bullish reversal to less-charted territory.
Recall that Monday’s session low (34,176) registered near the range top (34,160) amid a successful retest. Bullish price action.
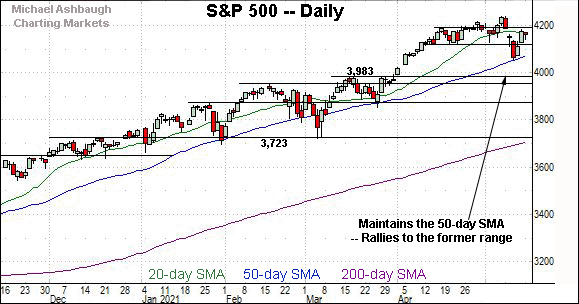
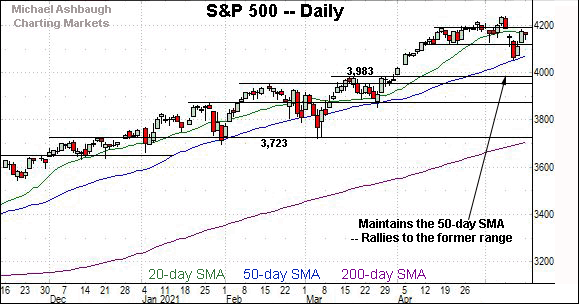
Meanwhile, the S&P 500 has sustained a rally to its former range.
The prevailing upturn punctuates a successful test of the 50-day moving average, currently 4,077.
The bigger picture
Collectively, the major U.S. benchmarks remain in divergence mode amid volatile May price action.
Against this backdrop, the S&P 500 and Dow industrials have retained a bullish intermediate-term bias.
Meanwhile, the Nasdaq Composite’s intermediate-term bias remains bearish-leaning, though the index has followed through early Tuesday, building on a promising rally attempt from the May low.
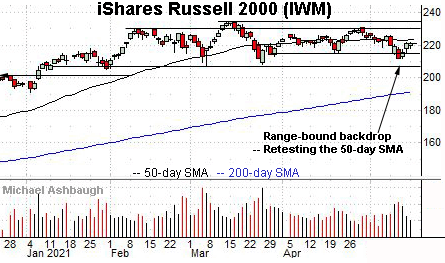
Moving to the small-caps, the iShares Russell 2000 ETF remains range-bound.
Recall the small-cap benchmark has not strayed too far from its 50-day moving average, currently 223.24, in recent weeks.
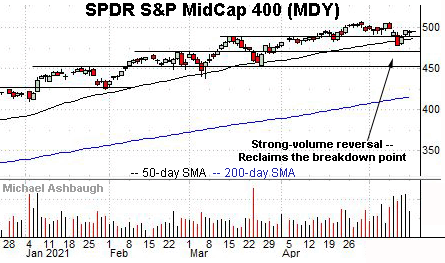
True to recent form, the SPDR S&P MidCap 400 remains comparably stronger.
Tactically, the MDY’s breakout point (489.50) is followed by the 50-day moving average, currently 486.92.
Placing a finer point on the S&P 500, the index has rallied to its former range.
Technically, recall that last week’s bullish reversal — from the 50-day moving average — registered as unusually strong, fueled by nearly 9-to-1 positive breadth. (NYSE advancing volume surpassed declining volume by a nearly 9-to-1 margin.)
The aggressive rally punctuates a May volatility spike.
More broadly, the sharp reversal from the May low preserves a comfortably bullish intermediate-term bias.
Consider that the S&P has registered just one close materially under its 50-day moving average since early November. (The May low registered less than a point from the 50-day.)
Delving deeper, gap support — at 4,034 and 4,020 — is followed by the the S&P’s April breakout point (3,983). As detailed repeatedly, the S&P 500’s intermediate-term bias remains bullish barring a violation of the 3,980 area.
Watch List
Drilling down further, consider the following sectors and individual names:
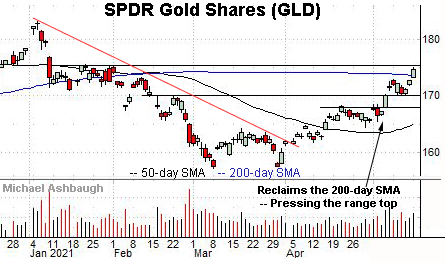
To start, the SPDR Gold Shares has come to life technically, rising amid a softening U.S. dollar.
In the process, the shares have reached three-month highs, rising atop the 200-day moving average, currently 173.58.
The prevailing upturn punctuates a bull flag — the tight one-week range — hinged to the steep early-May rally.
More immediately, the shares are challenging a five-month range top (175.51).
Tactically, the 200-day moving average is followed by the breakout point (172.80) and the former range bottom (170.20). The prevailing rally attempt is intact barring a violation.
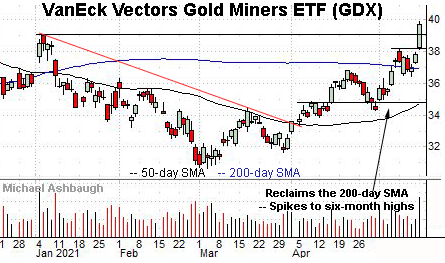
Meanwhile, the VanEck Vectors Gold Miners ETF — profiled May 7 — has broken out.
Specifically, the group has knifed to six-month highs, placing distance atop the 200-day moving average amid a volume spike.
Against this backdrop, Monday’s close (39.68) registered slightly atop the group’s near-term target (39.50) detailed previously.
Though near-term extended, and due to consolidate, the group’s May price action signals a primary trend shift.
Tactically, the Jan. peak (39.00) is followed by near-term support (38.10) and the 200-day moving average. A sustained posture higher signals a bullish bias.
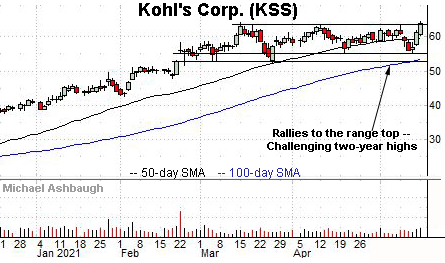
Moving to specific names, Kohl’s Corp. is a well positioned large-cap retailer. (Yield = 1.6%.)
Technically, the shares are challenging two-year highs on increased volume. The prevailing upturn punctuates an orderly three-month range.
Tactically, near-term support, circa 61.80, is followed by the 50-day moving average, currently 59.70. A breakout attempt is in play barring a violation.
Note the company’s quarterly results are due out Thursday, May 20.
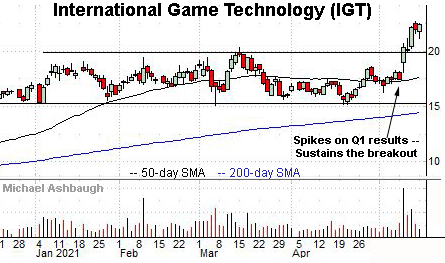
International Game Technology is a mid-cap London-based provider of gaming technologies products and services.
Earlier this month, the shares knifed to 33-month highs, rising after the company’s strong quarterly results.
Though still near-term extended, and due to consolidate, the strong-volume spike is longer-term bullish. Tactically, the breakout point (19.80) pivots to well-defined support.
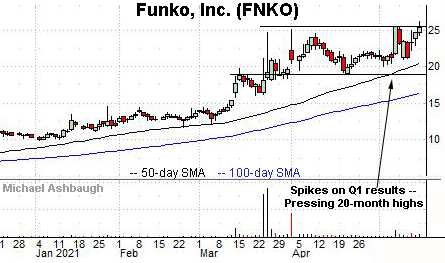
Finally, Funko, Inc. is a mid-cap producer of pop-culture consumer products.
The shares initially spiked two weeks ago, knifing to the range top after the company’s strong first-quarter results.
More immediately, the shares have returned to the range top, rising to challenge 20-month highs.
Tactically, a breakout attempt is in play barring a violation of near-term support, circa 23.80. A near-term target projects to just under the 30 mark on follow-through.


