Charting a bullish May start, Dow industrials take flight
Focus: 10-year Treasury yield presses two-month range bottom, Gold miners stage trendline breakout, TXN, GDX, TMUS, EMR, AUY
U.S. stocks are higher early Friday, rising after a soft monthly U.S. jobs report strengthened the case for prolonged accommodative monetary policy.
Against this backdrop, the Dow Jones Industrial Average taken flight — amid a bullish two standard deviation breakout — while the Nasdaq Composite has rallied early Friday back atop key resistance.
Editor’s Note: As always, updates can be accessed at chartingmarkets.substack.com. Your smartphone smartphone can also access updates at the same address, chartingmarkets.substack.com.
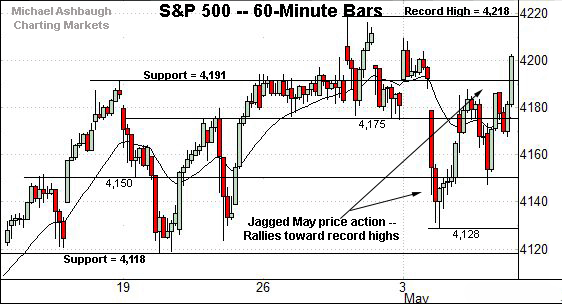
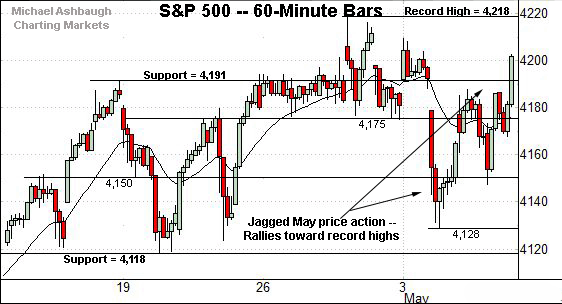
Before detailing the U.S. markets’ wider view, the S&P 500’s hourly chart highlights the past four weeks.
As illustrated, the S&P has reversed from a jagged May start.
In the process, the index has reclaimed its range top (4,191) rising to register its second-ever close atop the 4,200 mark.
More immediately, the S&P has tagged its latest record high early Friday, and is vying to close the week atop its record close (4,211.47).
Meanwhile, the Dow Jones Industrial Average has broken out.
The prevailing upturn punctuates a nearly one-month range, placing the index in previously uncharted territory.
Tactically, the breakout point (34,256) is followed by the former range top (34,160).
True to recent form, the Nasdaq Composite remains the weakest major benchmark.
Still, the index has weathered a shaky test of the 50-day moving average despite the May downturn.
Tactically, major resistance broadly spans from about 13,698 to 13,729, levels matching the breakdown point and the Jan. peak, detailed previously. A sustained reversal atop this area would place the Nasdaq on firmer technical ground.
More distant inflection points match the early-May gap — at 13,795 and 13,881. The Nasdaq has ventured into the gap with Friday’s strong start.
Widening the view to six months adds perspective.
On this wider view, the Nasdaq has snapped a four-session losing streak to punctuate an apparently successful retest of the 50-day moving average.
Against this backdrop, the index has reclaimed its breakdown point early Friday — the 13,700-to-13,730 area — also detailed on the hourly chart. Tactically, a sustained reversal atop this area strengthens the bull case.
More broadly, recall the early-May downturn registered amid internally tame selling pressure, on the order of less than 2-to-1 negative breadth. The May pullback appeared to be garden-variety.
Looking elsewhere, the Dow Jones Industrial Average has broken out.
The prevailing upturn marks the “expected” follow-through from the tight three-week range, a bullish continuation pattern.
Moreover, the upturn marks a bullish two standard deviation breakout. The Dow is vying Friday to register its second straight session close atop the 20-day Bollinger bands. (Bands not illustrated.)
As detailed previously, a near-term target projects to the 34,700 area.
Meanwhile, the S&P 500 is pressing its range top.
Tactically, the index has tagged a record high early Friday, and is vying to conclude the week atop its record close (4,211.47).
The prevailing upturn punctuates an early-week test of the 20-day moving average.
The bigger picture
As detailed above, the U.S. bigger-picture backdrop is not one-size-fits-all.
Nonetheless, the prevailing technicals collectively support a still comfortably bullish intermediate-term bias.
On a headline basis, the Dow Jones Industrial Average has knifed to record territory, while the Nasdaq Composite has survived a retest of its 50-day moving average.
More broadly, the May price action remains rotational.
Moving to the small-caps, the iShares Russell 2000 ETF remains range-bound.
An extended test of its 50-day moving average, currently 223.32, remains underway.
True to recent form, the SPDR S&P MidCap 400 remains incrementally stronger.
The MDY has maintained a posture atop its breakout point, circa 489.50, amid a modest May pullback.
Placing a finer point on the S&P 500, the index has reclaimed its range top (4,191), reaching a less-charted patch.
More immediately, the S&P has tagged its latest record high early Friday, and is vying to close the week atop its record close (4,211.47).
Tactically, the prevailing upturn punctuates a relatively tight one-month range.
The range spans precisely 100 points — from 4,118 to 4,218 — or about 2.4%. (Also see the hourly chart.)
Friday’s early upturn punctuates the bullish continuation pattern. On further strength, a near- to intermediate-term target projects to the 4,308-to-4,318 area.
Beyond technical levels, the S&P 500 has registered a constructive start to May, and the worst six-month seasonal period. All trends technically point higher based on today’s backdrop.
Friday’s Watch List
Drilling down further, consider the following sectors and individual names:
To start, the 10-year Treasury yield has pulled in, briefly tagging two-month lows after the weaker-than-expected monthly U.S. jobs report.
The downturn punctuates a pullback from recent 15-month highs.
Tactically, the 1.50-to-1.53 area defines the prevailing range bottom. Delving deeper, the 2016 low (1.34) marks a significant floor. (Territory under the 2016 low (1.34) marks the “pandemic zone,” an area that may never be revisited.)
Slightly more broadly, the yield’s prevailing two-month range is a bullish continuation pattern to the extent the 1.50 area is maintained. The weekly close will likely add color.
Conversely, overhead inflection points match the 50-day moving average, currently 1.61, and the late-April range top (1.69).
Moving to U.S. sectors, the VanEck Vectors Gold Miners ETF is showing signs of life technically.
As illustrated, the group has rallied to challenge four-month highs on increased volume.
The prevailing upturn punctuates a bullish cup-and-handle defined by the February and late-April lows. A near-term target projects to the 39.50 area on follow-through.
Conversely, the former range top (36.30) is followed by near-term support, circa 34.30. The group’s recovery attempt is intact barring a violation.
Moving to specific names, T-Mobile US, Inc. is a well positioned large-cap mobile communications services provider.
Technically, the shares have knifed to record highs, rising after the company’s first-quarter results. The prevailing upturn punctuates an orderly one-month range underpinned by the 50-day moving average.
Though near-term extended, and due to consolidate, the sustained strong-volume spike is longer-term bullish. Tactically, the breakout point (135.50) pivots to support and is closely followed by the April range top (134.10).
Emerson Electric Co. is a large-cap developer of engineering, automation and HVAC solutions. (Yield = 2.1%.)
As illustrated, the shares have rallied to the range top, rising to challenge record highs after the company’s quarterly results released Wednesday.
The prevailing upturn punctuates a tight six-week range — and has been fueled by increased volume — laying the groundwork for potentially decisive follow-through. Tactically, a near-term target projects to the 98 area.
Finally, Yamana Gold, Inc. is a mid-cap Toronto-based miner coming to life. (Yield = 2.1%.)
Technically, the shares have knifed atop trendline resistance, rising to tag three-month highs. The trendline breakout, combined with the “higher high” versus the April peak, signals a trend shift.
Underlying the upturn, Yamana’s relative strength index (not illustrated) has registered its best levels since August, improving the chances of upside follow-through.
Tactically, the breakout point (5.05) is followed by trendline support, circa 4.80. The prevailing rally attempt is intact barring a violation.


