Charting market cross currents, S&P 500 reclaims the breakdown point
Focus: Energy sector's stealth breakout attempt, XLE, SLB, DDD, CNC, STNG
U.S. stocks are lower early Monday, pressured amid persistently jagged May price action.
Against this backdrop, the S&P 500 has reclaimed its breakdown point (4,118) — amid firmly-bullish internals — to punctuate last week’s successful test of the 50-day moving average.
Editor’s Note: As always, updates can be directly accessed at chartingmarkets.substack.com. Your smartphone can also access updates at the same address, chartingmarkets.substack.com.
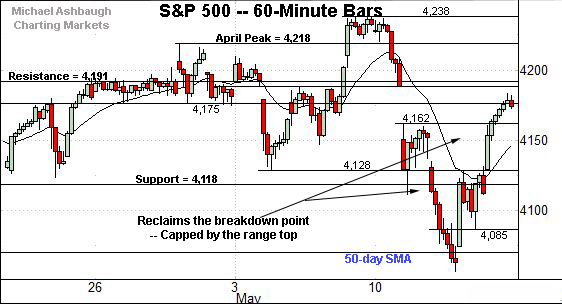
Before detailing the U.S. markets’ wider view, the S&P 500’s hourly chart highlights the past four weeks.
As illustrated, the S&P has reversed to its former range, rising from a successful test of the 50-day moving average.
Tactically, the early-May low (4,128) is closely followed by the former range bottom (4,118).
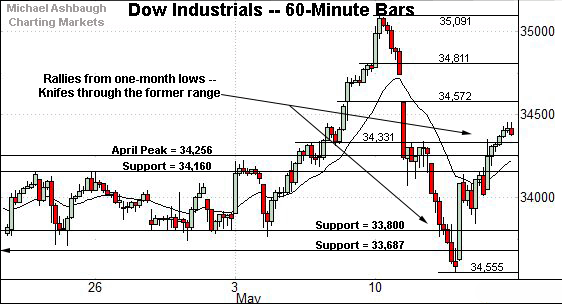
Meanwhile, the Dow Jones Industrial Average has rallied respectably from one-month lows.
The bullish reversal has knifed straight through the former range.
Tactically, the April peak (34,256) is followed by the former range top (34,160).
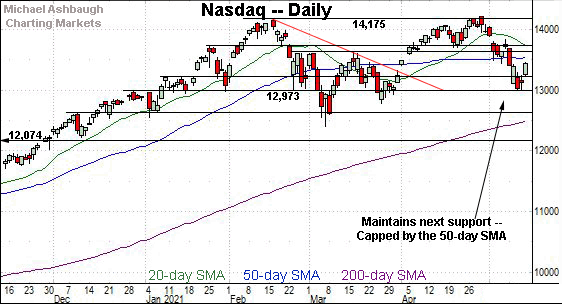
True to recent form, the Nasdaq Composite remains the weakest major benchmark.
Nonetheless, the index has established support around the 13,000 mark. Consecutive session lows have registered within seven points.
Tactically, trendline resistance, circa 13,450, is followed by the more distant 50-day moving average, currently 13,548.
Widening the view to six months adds perspective.
On this wider view, the Nasdaq has reversed respectably from the 13,000 mark, a level closely followed by the 2020 peak (12,973).
Tactically, the early-April gap (13,404) is followed by the 13,450 area — (see the hourly chart) — and the 50-day moving average.
More distant overhead matches the March peak (13,620).
The Nasdaq’s prevailing backdrop supports a bearish-leaning intermediate-term bias pending follow-through atop resistance. The retests from underneath will likely add color.
(On a positive note, Friday’s sharp reversal was fueled by firmly-bullish internals, approaching 8-to-1 positive breadth. The 13,000 area remains a notable bull-bear inflection point.)
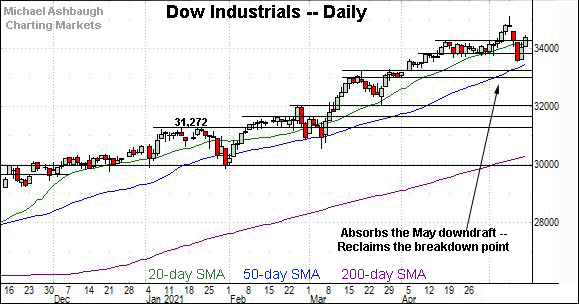
Looking elsewhere, the Dow Jones Industrial Average has whipsawed amid its former range.
To reiterate, the April peak (34,256) remains an inflection point, and is followed by the former range top (34,160).
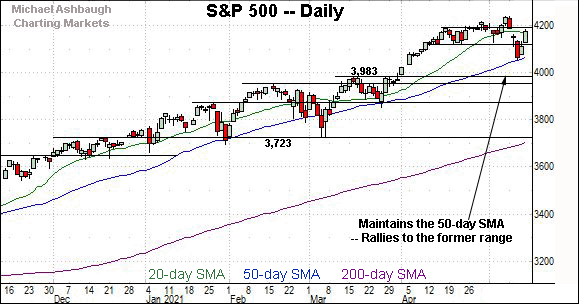
Meanwhile, the S&P 500 has rallied to its former range.
The prevailing upturn punctuates a successful test of the 50-day moving average, currently 4,070. Recall the May low registered less than a point from the 50-day.
The bigger picture
As detailed above, the prevailing bigger-picture backdrop is not one-size-fits-all.
On a headline basis, the S&P 500 and Dow industrials have managed to retain a bullish intermediate-term bias throughout the May volatility.
Meanwhile, the Nasdaq Composite’s intermediate-term bias remains bearish, though its backdrop is less straightforward.
(Friday’s nearly 8-to-1 bullish reversal from major support weakens the Nasdaq’s bear case. Still, a developing double top remains in play, and the index has yet to reclaim material resistance. The pending retests from underneath should add color.)
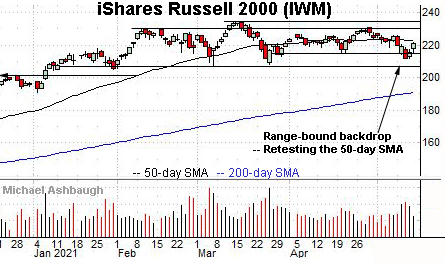
Moving to the small-caps, the iShares Russell 2000 ETF remains range-bound.
Within the range, the 50-day moving average, currently 223.12, marks an inflection point.
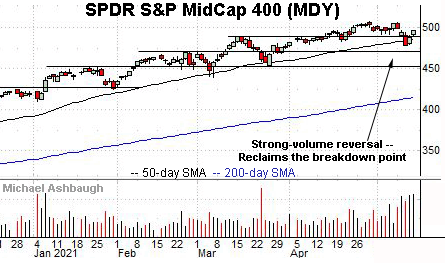
Meanwhile, the SPDR S&P MidCap 400 remains comparably stronger.
Tactically, the MDY’s breakout point (489.50) is followed by the 50-day moving average, currently 486.16.
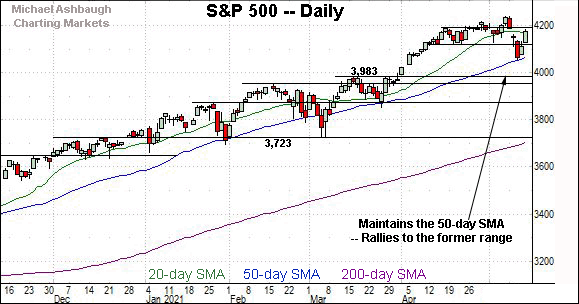
Placing a finer point on the S&P 500, the index has rallied to its former range.
Notably, Friday’s reversal atop the breakdown point (4,118) was fueled by nearly 9-to-1 positive breadth. (NYSE advancing volume surpassed declining volume by a nearly 9-to-1 margin.)
The bullish reversal punctuates persistently jagged May price action.
More broadly, the successful test of the 50-day moving average — and reversal back to the former range amid firmly-bullish internal strength — is technically constructive.
Tactically, the prevailing range bottom (4,118) is followed by the 50-day moving average, currently 4,070, and the May low (4,057).
Delving deeper, gap support — at 4,034 and 4,020 — is followed by the the S&P’s April breakout point (3,983). Broadly speaking, the S&P 500’s intermediate-term bias remains bullish barring a violation of the 3,980 area.
The Watch List
Drilling down further, consider the following sectors and individual names:
To start, the Energy Select Sector SPDR is acting well technically. (Yield = 4.2%.)
As illustrated, the group has asserted a relatively orderly May range, pressing 15-month highs. An intermediate-term target projects to the 62 area on follow-through.
Conversely, the early-month breakout point (50.75) is closely followed by the 50-day moving average, currently 50.25. A breakout attempt is in play barring a violation.
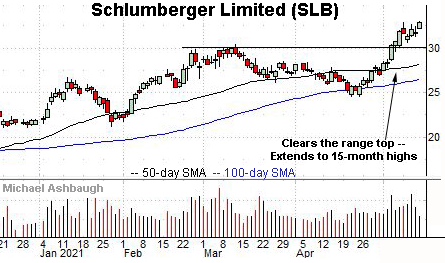
Schlumberger Limited is a well positioned large-cap oil services name. (Yield = 1.6%.)
Earlier this month, the shares knifed to 15-month highs, clearing resistance matching the March peak. The subsequent flag-like pattern has been punctuated by modest follow-through.
Tactically, the former range top (32.20) is followed by the firmer breakout point (30.10). A sustained posture higher signals a firmly-bullish bias.
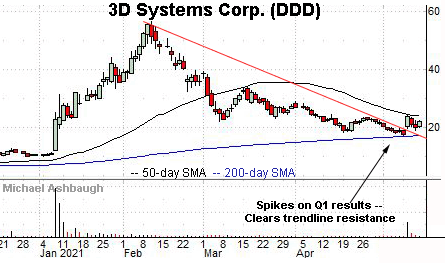
3D Systems Corp. is a mid-cap developer of 3D printing and digital manufacturing solutions.
Technically, the shares have recently knifed atop trendline resistance, rising after the company’s first-quarter results. The strong-volume spike punctuates a successful test of the 200-day moving average.
By comparison, the subsequent pullback has been flat, positioning the shares to build on the initial rally.
Tactically, the post-breakout closing low (20.10) is followed by trendline support matching the 200-day moving average. The prevailing rally attempt is intact barring a violation.
Centene Corp. is a large-cap provider of health care plans designed for the under-insured.
Earlier this month, the shares knifed to the range top, rising amid a volume spike after the company appointed a new CFO.
The subsequent tight range signals muted selling pressure near resistance, laying the groundwork for potential follow-through. Tactically, a breakout attempt is in play barring a violation of the prevailing range bottom (67.65).
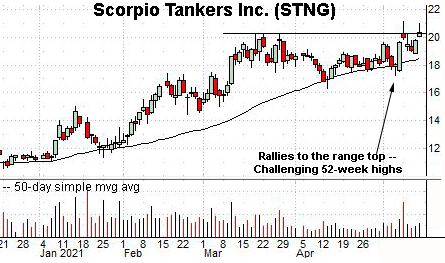
Finally, Scorpio Tankers, Inc. is a mid-cap Monaco-based oil tanker name. (Yield = 2.0%.)
As illustrated, the shares have knifed to the range top, rising to challenge 52-week highs. (The early-May strong-volume spike followed the company’s first-quarter revenue miss.)
The prevailing upturn punctuates a massive cup-and-handle defined by the October and April lows. A near-term target projects to the 23 area on follow-through.
Tactically, a breakout attempt is in play barring a violation of the 50-day moving average, currently 18.54, a level that has underpinned the prevailing uptrend.


