Market cross currents persist, Nasdaq rises to challenge key trendline
Focus: S&P 500 absorbs September downturn, spikes to reclaim 50-day average
Technically speaking, the major U.S. benchmarks remain in divergence mode following consecutive summer volatility spikes.
Amid the cross currents, the Nasdaq Composite has rallied to a technical test — pressing trendline resistance and the 50-day moving average (17,520) — while the Dow Jones Industrial Average continues to outperform. The charts below add color:
Editor’s Note: As always, updates can be directly accessed at chartingmarkets.substack.com.
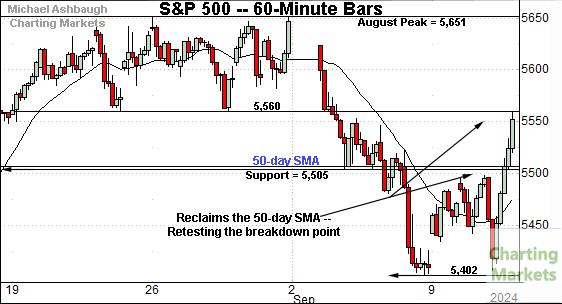
Before detailing the U.S. markets’ wider view, the S&P 500’s hourly chart highlights the past four weeks.
As illustrated, the S&P 500 has reclaimed an inflection point detailed previously.
The specific area matches major support (5,505) and the 50-day moving average, currently 5,508.
More immediately, the prevailing steep upturn has balked at the S&P’s breakdown point (5,560). At least initially.
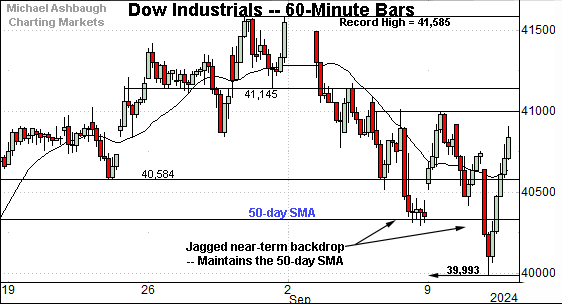
Meanwhile, the Dow Jones Industrial Average has thus far maintained two inflection points.
The specific areas match the 50-day moving average, currently 40,325, and major support hinged to the 40,000 mark. Both levels are also detailed on the daily chart.
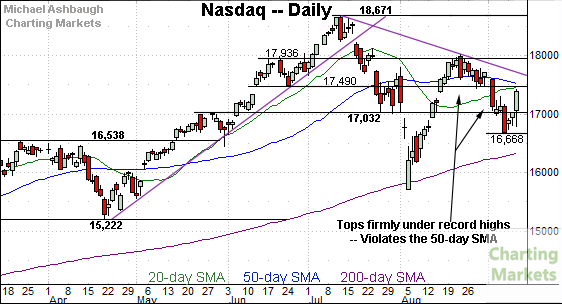
Against this backdrop, the Nasdaq Composite remains capped by three notable inflection points.
The specific areas match trendline resistance, the breakdown point (17,440) and the 50-day moving average, currently 17,520.
So collectively, each big three U.S. benchmark has asserted a different posture versus its 50-day moving average. A market divergence remains in play.
Widening the view to six months adds perspective.
On this wider view, the Nasdaq is digesting a wide-ranging market whipsaw.
Amid the volatility, the index has has weathered a test of its 200-day moving average — a widely-tracked longer-term trending indicator — at the August low.
Still, three subsequent developments raise question marks:
The Nasdaq has topped firmly under its record high, to punctuate a “lower high” at the August peak versus the July peak.
The September downturn places the Nasdaq under its 50-day moving average, currently 17,520.
The 50-day’s slope has ticked modestly lower, consistent with a potential intermediate-term trend shift.
So collectively, the Nasdaq’s intermediate-term bias is in flux. The hallmarks of a potential trend shift are in play.
More broadly, the Nasdaq’s longer-term bias remains bullish barring an eventual violation of the 200-day moving average, currently 16,335.
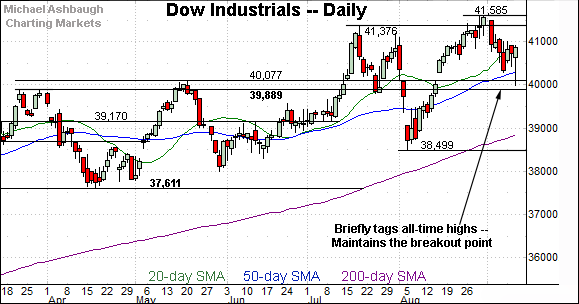
Looking elsewhere, the Dow Jones Industrial Average continues to outpace the other benchmarks.
In fact, the index briefly tagged an all-time high to conclude August.
More immediately, the September pullback has been orderly, underpinned by the 50-day moving average, currently , 40,325, and its former breakout point, hinged to the 40,000 mark.
Constructive price action.
Meanwhile, the S&P 500’s backdrop splits the difference between that of the other two benchmarks.
To start, the S&P did not register an all-time high at the August peak, underperforming the Dow industrials.
But on the positive side, the index has held relatively tightly to its range top (in the broad sweep) and is positioned atop its 50-day moving average, outpacing the Nasdaq.
The bigger picture
As detailed above, the major U.S. benchmarks remain in divergence mode. The prevailing backdrop is not one-size-fits-all.
On a headline basis, the Dow industrials continue to outperform — pulling in from recent record highs — while the Nasdaq’s intermediate-term bias is currently in flux.
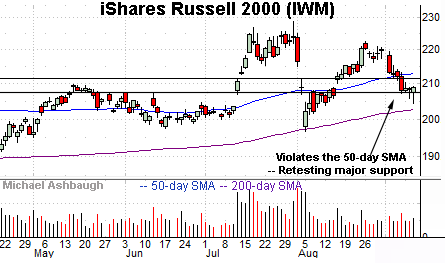
Moving to the small-caps, the iShares Russell 2000 ETF (IWM) has staged a modest September downturn.
Recent weakness places the small-cap benchmark back under the 50-day moving average, currently 213.05.
More immediately, an extended test of major support — the 207 area — remains underway.
On further weakness, the marquee 200-day moving average, currently 202.80, is within view. Recall the August low effectively matched the 200-day.
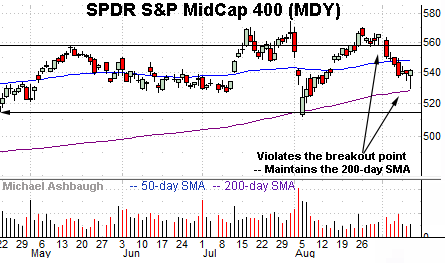
Meanwhile, the SPDR S&P MidCap 400 ETF (MDY) has pulled in to its former range.
Here again, the prevailing downturn places the 200-day moving average — a widely-tracked longer-term trending indicator — firmly within view.
Note the 200-day moving average has underpinned the August and September lows.
Returning to the S&P 500, the index is acting relatively well technically.
Though the August peak registered slightly under its all-time high — by about 18 points — the index continues to broadly hold its summer range top.
Tactically, initial support matches the 5,400 mark. (See the Sept. low (5,402) and the June gap.)
Delving deeper, the 5,340 area — detailed previously — remains a more important inflection point. (Recall the Aug. 2 close (5,346) and Aug. 9 close (5,344). Both marked weekly closes.)
As always, it’s not just what the markets do, it’s how they do it.
But generally speaking, the S&P’s intermediate-term bias remains bullish-leaning to the extent it maintains the 5,340-to-5,400 area. But note that a violation of the 5,340 area would raise a caution flag, likely opening the path to an eventual retest of the 200-day moving average.
Also see Aug. 29: Charting market cross currents, Nasdaq rises to challenge 50-day average.


