Market rotation persists, Nasdaq violates 50-day average
Focus: Dow industrials and Russell 2000 strengthen amid shifting market leadership
Technically speaking, the major U.S. benchmarks continue to diverge as market rotation persists.
Against this backdrop, the Dow industrials — as well as the small- and mid-caps — have strengthened in recent weeks, rising as the Nasdaq Composite remains under pressure. The charts below add color:
Editor’s Note: As always, updates can be directly accessed at chartingmarkets.substack.com.
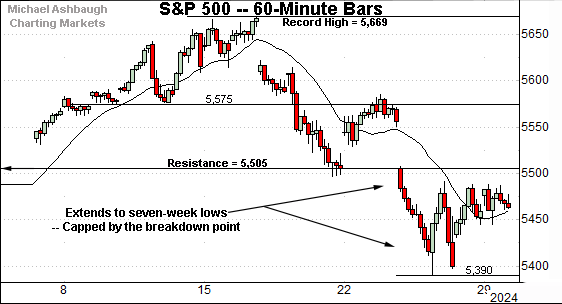
Before detailing the U.S. markets’ wider view, the S&P 500’s hourly chart highlights the past four weeks.
As illustrated, the S&P 500 has pulled in respectably from recent record highs.
Tactically, the breakdown point (5,505) pivots to resistance — an area detailed previously — and also illustrated on the daily chart.
Meanwhile, the Dow Jones Industrial Average continues to strengthen versus the other major benchmarks
As illustrated, the recent pullback has been comparably flat — versus the steep early-July rally — signaling bullish momentum is intact.
Moreover, the downturn has been underpinned by major support (39,890), an area detailed previously, and also illustrated on the daily chart below. Bullish price action.
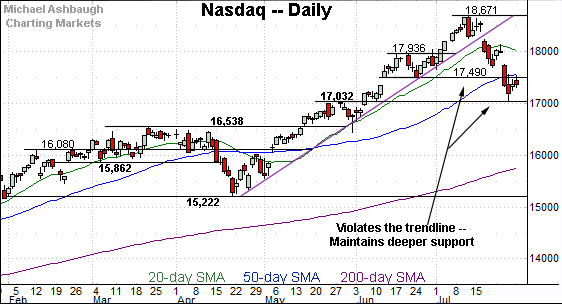
Against this backdrop, the Nasdaq Composite is digesting a downturn to seven-week lows.
Against this backdrop, the initial lift from major support (17,033) has been sluggish, signaling the downturn has not necessarily run its course.
Recall the Nasdaq’s recent weakness has registered amid market rotation.
Widening the view to six months adds perspective.
On this wider view, the Nasdaq has pulled in respectably, pressured to punctuate a trendline violation.
Tactically, gap resistance (17,490) is followed by the 50-day moving average, currently 17,564. This area marks an intermediate-term bull-bear fulcrum.
Delving deeper, the Nasdaq has thus far maintained next support (17,032), an area detailed previously. (See the July 17 review.)
The July low (17,033) effectively matched support amid a thus far successful retest.
Looking elsewhere, the Dow Jones Industrial Average has sustained its July break to all-time highs.
Recall the initial spike registered as statistically powerful, encompassing three straight closes atop the 20-day volatility bands (not illustrated).
The subsequent pullback has been underpinned by the breakout point (39,890) to punctuate a shaky, but successful, retest of major support. Bullish price action. (The late-July closing low (39,854) registered within 35 points of support.)
Tactically, recall an intermediate-term target projects from the former range to the 42,170 area.
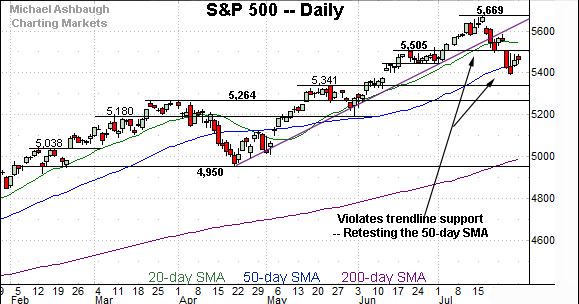
Meanwhile, the S&P 500 has also registered a mid-summer downturn.
Recent weakness punctuates a trendline violation, price action tracking that of the Nasdaq in key respects.
Amid the downturn, an extended retest of the 50-day moving average, currently 5,442, remains underway.
The bigger picture
As detailed above, the major U.S. benchmarks have diverged in recent weeks amid a backdrop is not one-size-fits-all.
On a headline basis, the S&P 500 and Nasdaq Composite have pulled in respectably from all-time highs, tagging the 50-day moving average — a widely-tracked intermediate-term trending indicator — across five straight sessions.
Meanwhile, the Dow Jones Industrial Average has strengthened versus the other benchmarks, sustaining a recent break to all-time highs. Elsewhere, the small- and mid-caps have also strengthened amid consequential price action detailed previously.
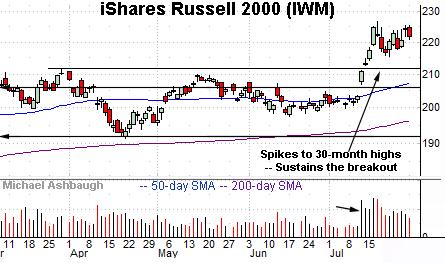
Moving to the small-caps, the iShares Russell 2000 ETF (IWM) has sustained its July breakout.
The initial strong-volume spike has been punctuated by a flattish pullback, signaling still muted selling pressure near recent highs.
Tactically, the prevailing flag-like pattern — hinged to the steep July rally — lays the groundwork for potential upside follow-through. A sustained posture atop the 215.40 area signals a firmly-bullish bias.
Meanwhile, the SPDR S&P MidCap 400 ETF (MDY) is challenging all-time highs.
Though the mid-July spike briefly placed the MDY in record territory, upside follow-through has thus far been elusive.
Tactically, a breakout attempt remains in play barring a violation of near-term support, circa 547, an area closely followed by the 50-day moving average, currently 542.60.
On a detailed note, recall the small- and mid-caps have both registered powerful two standard deviation breakouts, improving the chances of longer-term gains. (See the July 17 review.)
Returning to the S&P 500, the index has extended a downturn from recent record highs.
Tactically, the breakdown point — the 5,505 area, detailed previously — pivots to resistance. (The July 19 weekly close (5,505) precisely matched the inflection point.)
Against this backdrop, the 50-day moving average, currently 5,442, is rising toward the breakdown point.
So broadly speaking, the 5,440-to-5,500 area marks an intermediate-term bull-bear fulcrum. A sustained reversal atop this area would place the S&P on firmer technical ground.
Delving deeper, the May range top (5,341) remains the S&P’s next notable floor. The pending retest from above — to the extent the S&P pulls in this far — should be a useful bull-bear gauge.
Beyond technical levels, the rotational summer price action remains broad-market bullish, on balance. To reiterate, the bigger-picture backdrop is not one-size-fits-all.
Also see July 17: Charting market rotation, small-caps stage powerful July breakout.


