Charting market cross currents, Nasdaq rises to challenge 50-day average
Focus: Dow industrials tag all-time highs
Technically speaking, the major U.S. benchmarks have diverged in the wake of an August volatility spike.
Amid the cross currents, the Dow industrials have strengthened — rising to tag all-time highs — while the Nasdaq Composite has underperformed, pressured on a relative basis amid market rotation. The charts below add color:
Editor’s Note: As always, updates can be directly accessed at chartingmarkets.substack.com.
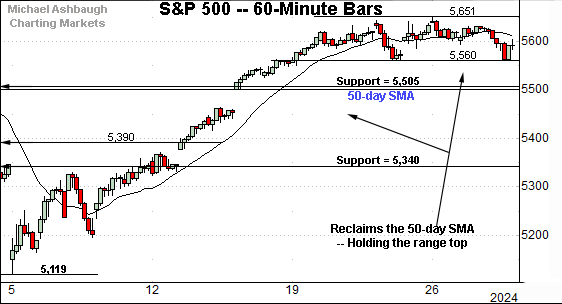
Before detailing the U.S. markets’ wider view, the S&P 500’s hourly chart highlights the past four weeks.
As illustrated, the S&P 500 is digesting a sharp reversal from the August low. The prevailing upturn has been punctuated by an unusually tight eight-session range.
Tactically, major support (5,505) closely matches the 50-day moving average, currently 5,500. Both areas are also detailed on the daily chart.
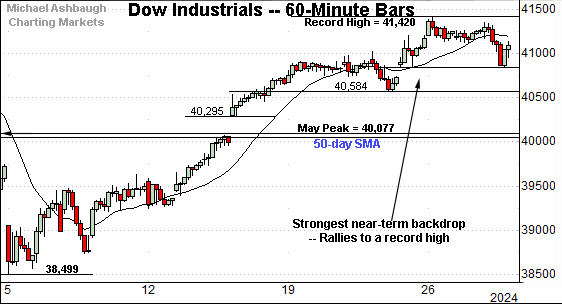
Meanwhile, the Dow Jones Industrial Average has registered a stronger August rally, rising to briefly tag all-time highs.
From current levels, major support (40,077) is closely followed by the 50-day moving average, currently 40,030. Here again, both areas are also detailed on the daily chart.
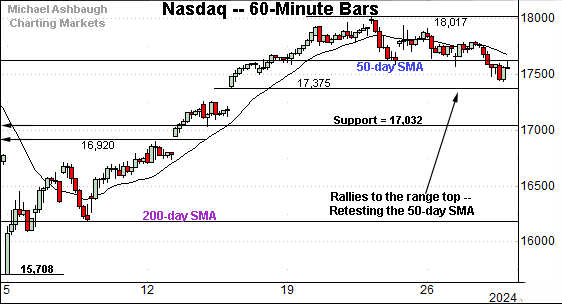
Against this backdrop, the Nasdaq Composite is also range-bound near the August highs.
But amid the holding pattern, the index has held tightly to its 50-day moving average, underperforming the other benchmarks.
Tactically, gap support (17,375) is followed by the Nasdaq’s firmer breakout point (17,032).
Widening the view to six months adds perspective.
On this wider view, the Nasdaq has registered a wide-ranging August whipsaw.
Amid the volatility, the index has successfully tested its 200-day moving average (in purple), a widely-tracked longer-term trending indicator.
More immediately, the Nasdaq has asserted an August range closely matching the June price action. The 50-day moving average nearly bisects this range.
Tactically, a break from the range top — the 17,940-to-18,020 area — strengthens the bull case. Conversely, a violation of the June breakout point (17,030) would place the recovery attempt in doubt. (Recall the August selling pressure accelerated amid the violation of this area (17,030).)
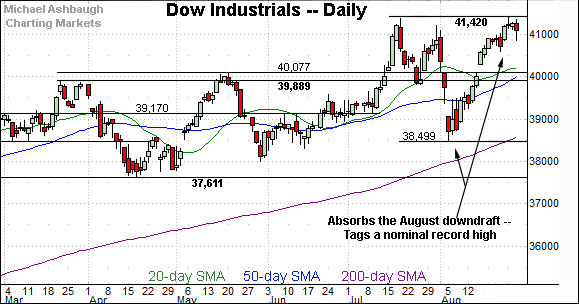
Looking elsewhere, the Dow Jones Industrial Average has strengthened amid recent volatility.
In fact, the index has narrowly tagged an all-time high (41,420).
Tactically, the Dow’s breakout point (40,077) is closely followed by the 50-day moving average, currently 40,030. A sustained posture atop this area signals a bullish intermediate-term bias. (This area also matches the mid-August gap (40,068).)
Meanwhile, the S&P 500 has registered a round-trip whipsaw from the August low.
The prevailing upturn has been punctuated by a tight eight-session range, slightly under the S&P’s all-time high (5,669).
The bigger picture
As detailed above, the major U.S. benchmarks have diverged in the wake of an August volatility spike.
Against this backdrop, the Dow industrials have strengthened amid the prevailing upturn, rising to tag an all-time high.
Meanwhile, the Nasdaq Composite has underperformed amid the recovery attempt, asserting a tight range hinged to its 50-day moving average.
And amid the cross currents, the S&P 500 has managed to rally within striking distance of its record high.
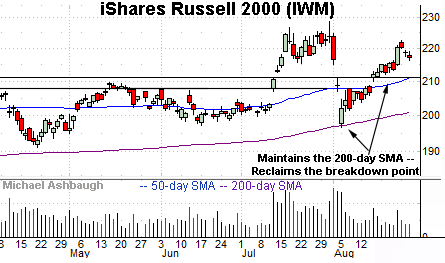
Moving to the small-caps, the iShares Russell 2000 ETF (IWM) has reversed respectably from the August low.
The prevailing upturn punctuates a successful test of the 200-day moving average, a widely-tracked longer-term trending indicator.
Tactically, the former breakdown point pivots to support (211.90) an area closely matching the 50-day moving average, currently 211.20. A sustained posture atop this area signals a bullish intermediate-term bias.
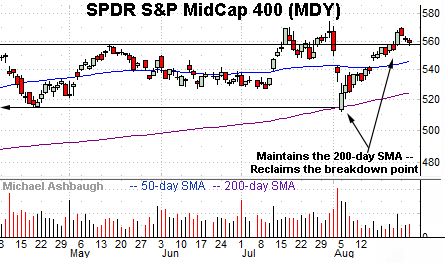
Similarly, the SPDR S&P MidCap 400 ETF (MDY) seems to have weathered the August downdraft.
Here again, the prevailing upturn originates from the 200-day moving average.
Moreover, the prevailing upturn punctuates a bullish island reversal defined by the early-August gaps. (The gaps are hinged to the 50-day moving average.)
Tactically, the 50-day moving average, currently 546.04, is followed by gap support (542.50). This area marks an intermediate-term bull-bear fulcrum.
Slightly more broadly, the small- and mid-caps have rallied on conspicuously decreased volume versus the initial downdraft. Sustainability and follow-through present a question mark based on today’s backdrop.
Returning to the S&P 500, the index has knifed from the August low. The subsequent tight range — a flag-like pattern — has registered slightly under the S&P’s all-time high (5,669).
From current levels, notable support (5,505) closely matches the 50-day moving average, currently 5,500. A sustained posture atop this area signals a bullish intermediate-term bias.
Delving deeper, the 5,340 area — detailed previously — remains an inflection point. (See the Aug. 2 close (5,346) and Aug. 9 close (5,344). Both closes marked weekly closes.)
Tactically, an eventual violation of the 5,340 area would raise a technical caution flag.
Beyond specific levels, the prevailing recovery attempt gets mixed marks for style internally.
The August price action has been rotational — which is bullish — though the volume and breadth stats have been lacking, perhaps because market leadership had been highly concentrated in the Magnificent Seven names. Large-cap tech has been underperforming, contributing to soft market internals that may not be as concerning as they appear at face value. Time will tell.
Also see Aug. 14: Charting a volatility spike, S&P 500 whipsaws at major support (5,340).


