Charting a bull-flag breakout attempt, Dow industrials challenge record highs
Focus: S&P 500 asserts bull flag, Nasdaq Composite traverses the range
Technically speaking, the major U.S. benchmarks are starting August amid a still bullish bigger-picture backdrop.
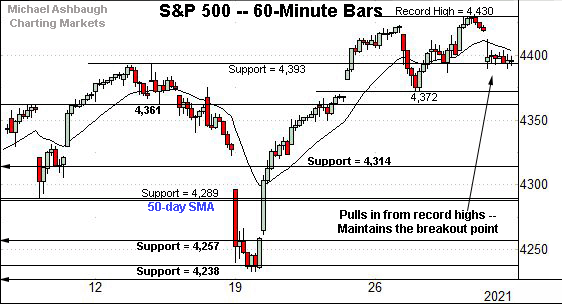
On a headline basis, the S&P 500 has asserted a bull flag, digesting its latest break to record territory.
Meanwhile, the Dow Jones Industrial Average continues to challenge record highs, rising amid broadening sector participation, detailed last week.
Editor’s Note: As always, updates can be directly accessed at chartingmarkets.substack.com. Your smartphone can also access updates at the same address.
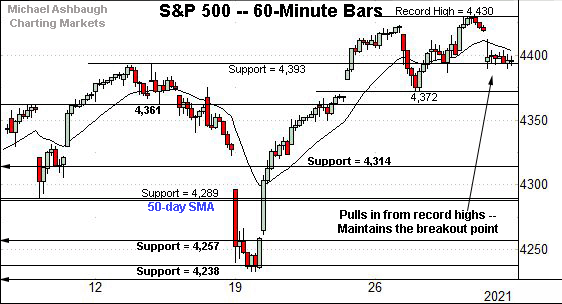
Before detailing the U.S. markets’ wider view, the S&P 500’s hourly chart highlights the past four weeks.
As illustrated, the S&P has thus far sustained its recent break to record territory.
Tactically, the breakout (4,393) is followed the late-July low (4,372).
The July close (4,395) — established to conclude last week — roughly matched the breakout point (4,393). Constructive price action.
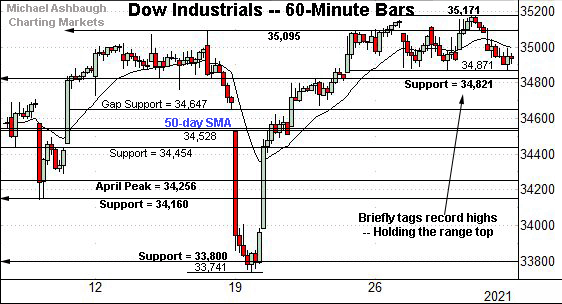
Meanwhile, the Dow Jones Industrial Average is holding its range top.
The prevailing flag-like pattern — the tight six-session range — signals muted selling pressure near record territory, improving the chances of upside follow-through.
More immediately, Monday’s early session high (35,192) has marked a nominal new record, amid a breakout attempt that remains underway.
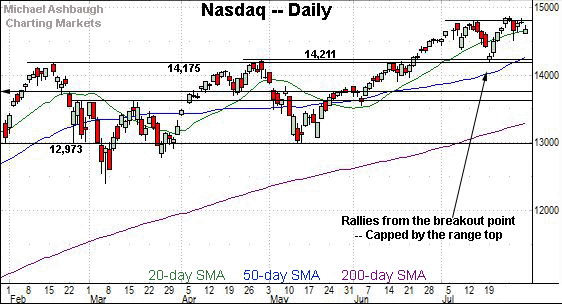
Against this backdrop, the Nasdaq Composite has pulled in to its range from recent record highs.
Fundamentally, Amazon.com’s earnings-fueled downdraft contributed to the Nasdaq’s relatively modest pullback. (See link for Amazon’s chart.)
More broadly, the prevailing range is underpinned by major support (14,175) also illustrated below.
Recall the July low (14,178) closely matched major support (14,175).
Widening the view to six months adds perspective.
On this wider view, the Nasdaq has pulled in to its range from last week’s nominal record high.
Still, the prevailing six-week range — underpinned by the breakout point (14,175) — is technically constructive.
More broadly, recall the mid-June breakout punctuated a double bottom — the W formation — defined by the March and May lows.
On further strength, a near- to intermediate-term target continues to project to the 15,420 area. (See the July 26 review.)
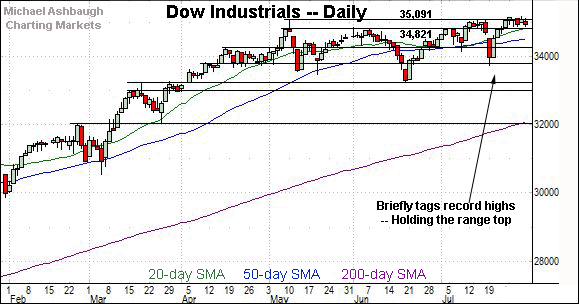
Looking elsewhere, the Dow Jones Industrial Average has held more tightly to its range top.
Tactically, recall the May peak (35,091) and mid-July peak (35,090) closely matched.
The Dow twice ventured atop resistance last week, though follow-through has been elusive.
Slightly more broadly, the prevailing flag pattern — the tight one-week range, hinged to the steep mid-July rally — is a bullish continuation pattern.
Also recall the prevailing upturn punctuates a modified inverse head-and-shoulders pattern, defined by the May, June and July lows.
Collectively, the Dow industrials’ backdrop remains constructive despite admittedly jagged summer price action.
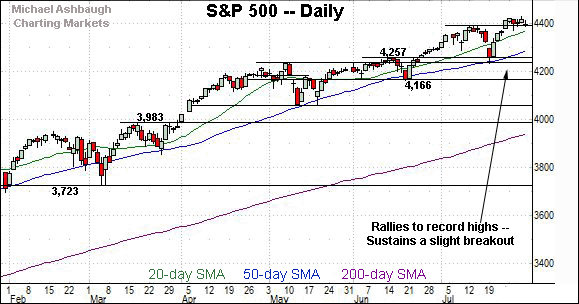
Meanwhile, the S&P 500 has sustained a modest break to record territory.
The prevailing flag pattern has been underpinned by the breakout point (4,393).
Recall the July close (4,395) roughly matched support.
The bigger picture
As detailed above, the major U.S. benchmarks are acting well technically.
On a headline basis, the S&P 500 has asserted a flag pattern, digesting a modest late-July breakout.
Meanwhile, the Dow Jones Industrial Average is challenging record highs, rising amid broadening sector participation, detailed last week.
Against this backdrop, the Nasdaq Composite has pulled in to its range, pressured slightly amid market rotation. (Put differently, the Nasdaq has been pressured at least partly as a source of funds deployed to other sectors.)
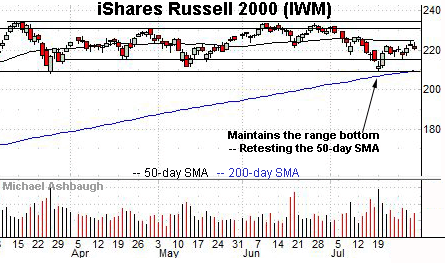
Moving to the small-caps, the iShares Russell 2000 ETF remains range-bound.
Within the range, an extended test of the 50-day moving average, currently 225.04, remains underway.
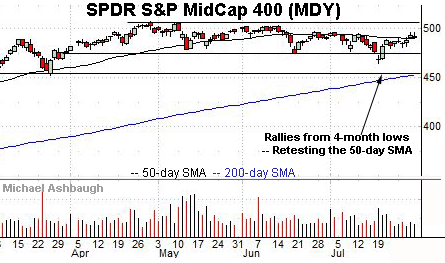
Meanwhile, the SPDR S&P MidCap 400 ETF has edged slightly atop its 50-day moving average, currently 490.78.
The MDY has registered consecutive closes atop the 50-day, another modest signal of broadening market participation.
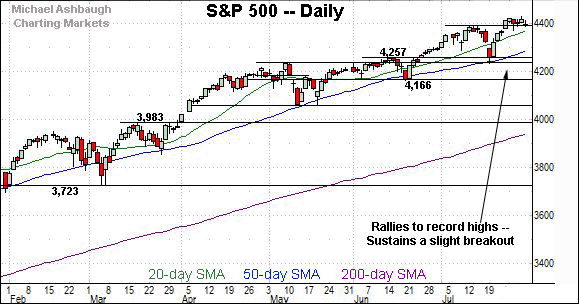
Placing a finer point on the S&P 500, the index has sustained its latest break to record territory.
Consider that six consecutive session closes have registered atop the breakout point (4,393). Constructive price action.
More broadly, the S&P 500’s six-month backdrop remains relatively straightforward.
Tactically, the prevailing bull flag — the tight one-week range — has been underpinned by the breakout point (4,393).
As always, the flag is a bullish continuation pattern, improving the chances of eventual upside follow-through.
Delving deeper, the 50-day moving average, currently 4,288, is followed by the breakout point (4,257) and the July low (4,233).
So collectively, relatively important support broadly spans from 4,233 to 4,257. An eventual violation would mark a material “lower low” — combined with a violation of the 50-day moving average — raising a technical question mark.
Beyond technical levels, the bigger-picture backdrop strengthened to conclude July, amid market rotation and broadening sector participation, detailed last week:
Against this backdrop, the S&P 500’s near-to intermediate-term bias remains comfortably bullish.
No new setups today. Back in action Wednesday.
Editor’s Note: As always, updates can be directly accessed at chartingmarkets.substack.com. Your smartphone can also access updates at the same address.


