Charting market cross currents, Dow industrials tag record highs
Focus: Crude oil's breakout attempt, Microsoft pulls in to key support, Caterpillar challenges record highs, USO, MSFT, CAT, NUE, HES
U.S. stocks are mixed early Thursday, vacillating as a May divergence persists.
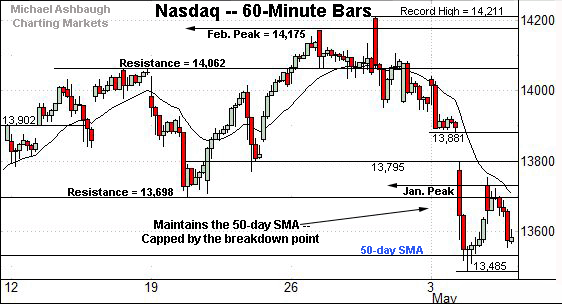
Against this backdrop, the Dow Jones Industrial Average has registered a modest break to record territory — rising from a tight three-week range — as the Nasdaq Composite continues to retest its 50-day moving average, currently 13,514.
Editor’s Note: Today’s review was delayed by a Substack.com technology glitch. As always, updates can be accessed directly at chartingmarkets.substack.com.
Before detailing the U.S. markets’ wider view, the S&P 500’s hourly chart highlights the past four weeks.
As illustrated, the S&P has whipsawed amid a jagged May start.
Tactically, the May low (4,128) is followed by firmer support matching the range bottom (4,118).
Conversely, the breakdown point (4,175) is followed by the former range top (4,191).
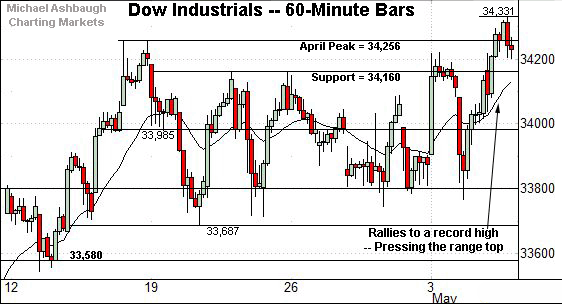
Meanwhile, the Dow Jones Industrial Average has tagged all-time highs.
Consider that Wednesday’s intraday high (34,331.20), and the session close (34,230.34), both marked nominal records.
In practice, an extended retest of the April peak (34,256) remains underway.
Tactically, the former range top (34,160) pivots to support.
Against this backdrop, the Nasdaq Composite remains the weakest major benchmark.
The index has registered a lackluster lift from one-month lows, a rally that has stalled near the breakdown point, detailed Wednesday.
Resistance broadly spans from about 13,698 to 13,729, levels matching the breakdown point and the Jan. peak, also illustrated below.
Widening the view to six months adds perspective.
On this wider view, the Nasdaq has registered four straight losing sessions, its longest stretch since October.
The downturn places the 50-day moving average, currently 13,514, under siege.
Tactically, a sustained violation of the 50-day would raise a technical question mark. Delving deeper, gap support — at 13,404 and 13,325 — is followed by a firmer floor matching the early-January peak (13,208) and mid-January gap (13,207).
More broadly, market bears might point to a developing double top defined by the February and April peaks.
Still, the May selling pressure has thus far registered as internally tame, not the hallmark of a major trend shift. Time will tell.
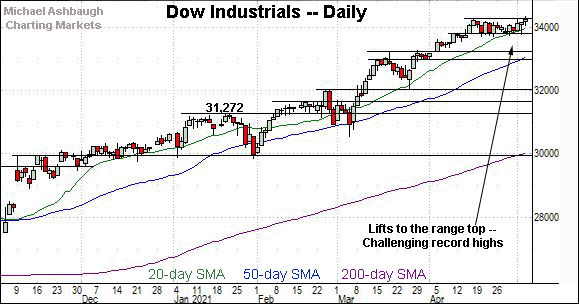
Looking elsewhere, the Dow Jones Industrial Average has tagged a nominal record high.
The prevailing upturn punctuates a tight three-week range, positioning the index for potentially more decisive follow-through. Tactically, a near-term target projects to the 34,700 area.
Conversely, familiar near-term support (33,800) is followed by prevailing range bottom (33,687).
Meanwhile, the S&P 500 has pulled in to its former range.
Tactically, the 20-day moving average, currently 4,165, is followed by firmer support matching the mid-April range bottom (4,118).
Recall the S&P has maintained its 20-day moving average — a widely-tracked near-term trending indicator — going back to March 10. (Maintained the 20-day on a closing basis.)
The bigger picture
Collectively, the U.S. benchmarks remain in divergence mode — each index is doing different things — amid a jagged May start.
On a headline basis, the Dow Jones Industrial Average has tagged all-time highs, while the Nasdaq Composite continues to challenge its 50-day moving average.
Put differently, the Nasdaq is vying to avert a bearish trend shift, even amid the Dow industrials’ breakout attempt.
Moving to the small-caps, the iShares Russell 2000 ETF has extended a modest May downturn.
In the process, the small-cap benchmark has ventured under its 50-day moving average, currently 223.14, though amid decreased volume.
Tactically, the April range bottom (215.24) marks a deeper floor.
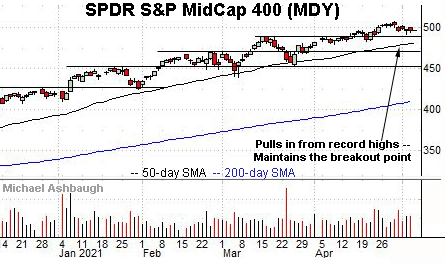
Perhaps not surprisingly, the SPDR S&P MidCap 400 remains incrementally stronger.
The MDY has sustained a rally atop its breakout point, circa 489.50, amid a modest May pullback.
Placing a finer point on the S&P 500, the index has pulled in to a relatively well-defined one-month range.
The prevailing downturn punctuates a jagged turn-of-the-month breakout attempt, amid thus far limited damage.
Tactically, the range bottom (4,118) is followed by a less-charted patch — a potential air pocket — and the 50-day moving average, currently 4,024.
Delving deeper, the breakout point (3,983) remains the S&P’s first significant support. Broadly speaking, the S&P 500’s intermediate-term path of least resistance continues to point higher barring a violation of the 3,980 area.
Thursday’s Watch List
Drilling down further, consider the following sectors and individual names:
To start, the United States Oil Fund tracks the spot price of light, sweet crude oil.
Technically, the shares have tagged 52-week highs, edging atop resistance matching the March peak.
The prevailing upturn punctuates a relatively tight one-week range. An intermediate-term target projects to just under the 50.00 mark on follow-through.
Conversely, the ascending 50-day moving average has marked an inflection point, and is rising toward the former range top (43.50). A sustained posture higher signals a bullish intermediate-term bias.
Moving to specific names, Microsoft Corp. is a well positioned Dow 30 component.
To be sure, the shares have been pressured of late, pulling in amid increased volume after the company’s better-than-expected third-quarter results, released late last month. (Concerns the results were aided by one-time benefits, including currency, tempered market reaction.)
But technically, the downturn places the shares near the breakout point (245.50) and 6.8% under the April peak.
Delving deeper, the 50-day moving average is followed by the former range top (238.00). Microsoft’s bullish intermediate-term bias gets the benefit of the doubt barring a violation.
Looking elsewhere, Caterpillar, Inc. is another well positioned Dow 30 component. (Yield = 1.7%.)
Technically, the shares have edged to all-time highs, clearing resistance matching the March and April peaks.
The prevailing upturn punctuates a tight six-week range, laying the groundwork for potentially more decisive follow-through. A near-term target projects to the 248 area.
Conversely, the breakout point (237.00) is followed by the former range bottom (225.50). A sustained posture higher signals a bullish bias.
Initially profiled last week, Nucor Corp. has taken flight. (Yield = 1.8%.)
Specifically, the shares have knifed to all-time highs, rising amid increased volume from a tight one-month range. The nearly straightline spike punctuates an unusually strong two standard deviation breakout, encompassing three straight closes atop the 20-day volatility bands. (Bands not illustrated.)
Though near-term extended, and due to consolidate, the strong May start is longer-term bullish. Tactically, the breakout point (81.50) pivots to well-defined support.
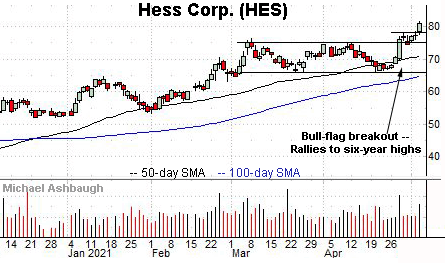
Finally, Hess Corp. is a well positioned large-cap oil and gas name.
As illustrated, the shares have staged a bull-flag breakout, tagging six-year highs on strong volume.
The upturn builds on a double bottom — the W formation — defined by the late-March and April lows.
Tactically, the former range top (78.25) marks a near-term floor. Delving deeper, major support spans from about 74.10 to 75.00, levels matching the 2019 peak and the breakout point respectively.


