Charting market rotation, Nasdaq holds key support
Focus: Materials sector tags record high, Alphabet sustains earnings-fueled breakout, XLB, GOOGL, CVS, CLF, PNC
U.S. stocks are generally higher early Wednesday, rising in the wake of a jagged May start.
Against this backdrop, the Nasdaq Composite has weathered a stealth retest of the 50-day moving average while the S&P 500 remains comparably resilient.
Editor’s Note: As always, updates can be accessed at chartingmarkets.substack.com. Your smartphone smartphone can also access updates at the same address, chartingmarkets.substack.com.
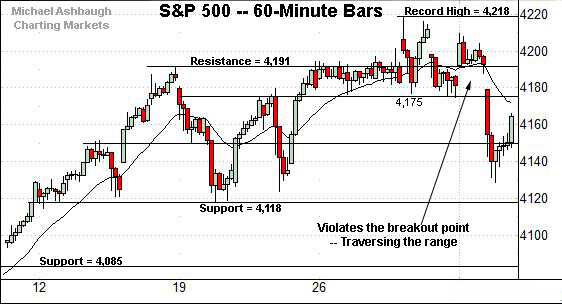
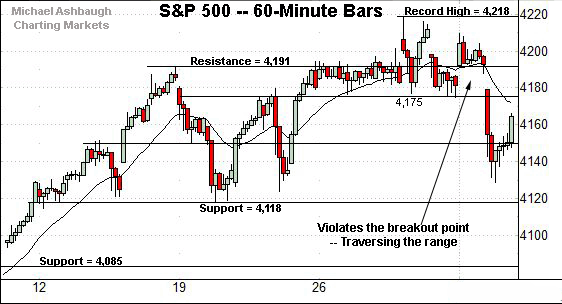
Before detailing the U.S. markets’ wider view, the S&P 500’s hourly chart highlights the past four weeks.
As illustrated, the S&P has pulled in to its range from recent record highs.
Tactically, the May low (4,128), established Tuesday, is closely followed by the range bottom (4,118).
Conversely, the breakdown point (4,175) is followed by the former range top (4,191).
Meanwhile, the Dow Jones Industrial Average is traversing a familiar range.
Tactically, the 33,800 area has effectively underpinned recent price action.
Conversely, the prevailing range top (34,160) is followed by the Dow’s record close (34,200.67) and absolute record peak (34,256.75).
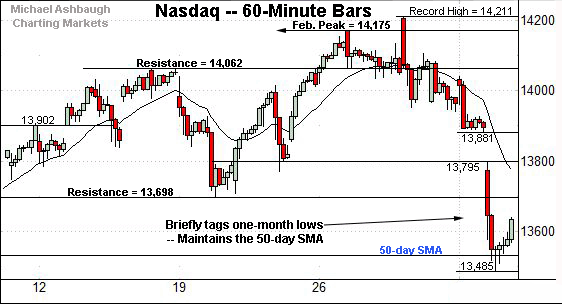
Against this backdrop, the Nasdaq Composite has pulled in more aggressively, briefly tagging one-month lows.
The downturn has been punctuated by a thus far successful test of the 50-day moving average, currently 13,518.
Tactically, the breakdown point, circa 13,700 is followed by the bottom of the gap (13,795).
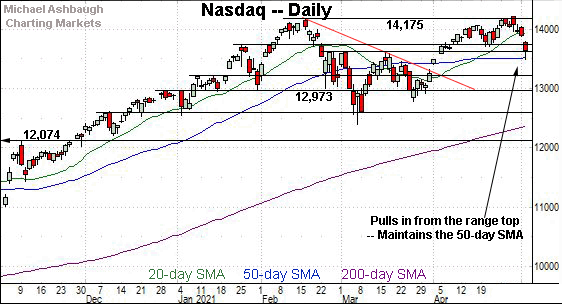
Widening the view to six months adds perspective.
On this wider view, the Nasdaq has pulled in respectably from last week’s nominal record high.
But notably, the downturn has been fueled by internally tame selling pressure. Consider that declining volume surpassed advancing volume by a less than 2-to-1 margin, even amid Tuesday’s 1.9% single-day downdraft.
Tactically, notable overhead broadly spans from 13,698 to 13,729, levels matching the breakdown point and the Jan. peak. A swift reversal atop this area would signal waning bearish momentum.
Conversely, the downturn has thus far been underpinned by the 50-day moving average, currently 13,518. Eventual follow-through under the 50-day would raise a technical question mark.
The Nasdaq’s intermediate-term bias remains bullish based on today’s backdrop.
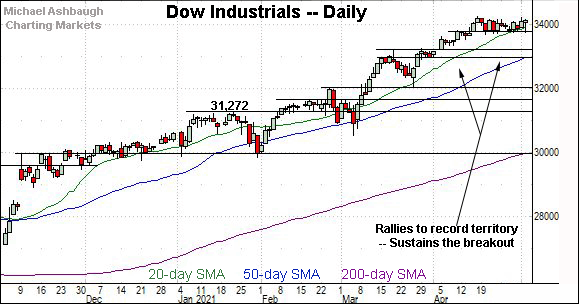
Looking elsewhere, the Dow Jones Industrial Average remains range-bound.
Recall that near-term support (33,800) is followed by prevailing range bottom (33,687), areas also illustrated on the hourly chart.
Conversely, the Dow’s range top (34,160) is closely followed by its record close (34,200), established April 16.
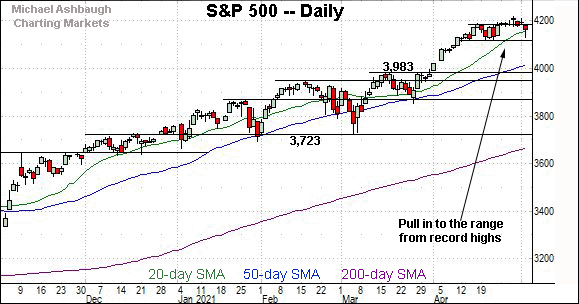
Meanwhile, the S&P 500 has pulled in to its former range from recent record highs.
Tactically, the 20-day moving average, currently 4,162, is followed by the mid-April range bottom (4,118).
(The S&P has maintained its 20-day moving average, on a closing basis, going back to March 10.)
The bigger picture
As detailed above, a relatively familiar market divergence has resurfaced to start May.
Namely, the Nasdaq Composite has been pressured — amid slightly damaging early-month price action — while the S&P 500 and Dow industrials remain comparably resilient. (The Nasdaq registered a 1.9% single-day loss Tuesday, while the Dow industrials added 20 points.)
Amid the cross currents, each benchmark’s intermediate-term bias remains bullish.
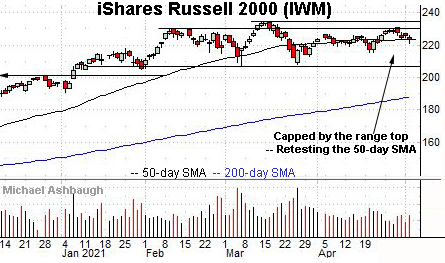
Moving to the small-caps, the iShares Russell 2000 ETF remains range-bound.
Tactically, an extended test of the 50-day moving average, currently 223.31, remains underway.
Tuesday’s close (223.29) effectively matched the 50-day.
Delving deeper, the April range bottom (215.24) remains an inflection point.
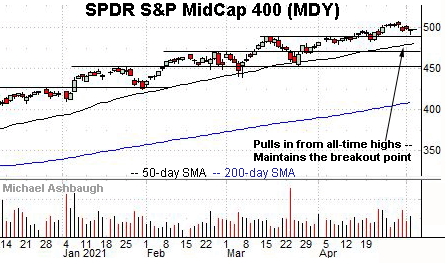
True to recent form, the SPDR S&P MidCap 400 remains incrementally stronger.
The MDY has thus far maintained a posture atop its breakout point, circa 489.50. (See the March peak (489.48) and early-April peak (489.47).)
Placing a finer point on the S&P 500, the index has pulled in to its range.
To reiterate, the May low (4,128), established Tuesday, is closely followed by a firmer floor matching the range bottom (4,118).
More broadly, the S&P’s former projected target (4,085) is followed by the 50-day moving average, currently 4,020.
Delving deeper, the breakout point (3,983) marks the S&P’s first significant support.
Beyond technical levels, the prevailing bigger-picture backdrop is not exactly one-size-fits-all. But as it applies to the S&P 500, a sustained posture atop the S&P 3,980 area signals a bullish intermediate-term bias.
Wednesday’s Watch List
Drilling down further, consider the following sectors and individual names:
To start, the Materials Select Sector SPDR is acting well technically. (Yield = 1.7%.)
As illustrated, the group has extended its uptrend, tagging record highs amid a volume uptick. Recent strength punctuates a successful early-April retest of the breakout point.
More broadly, the group’s upside follow-through — even amid the Nasdaq’s May downdraft — exemplifies a still rotational market backdrop. Constructive broad-market price action.
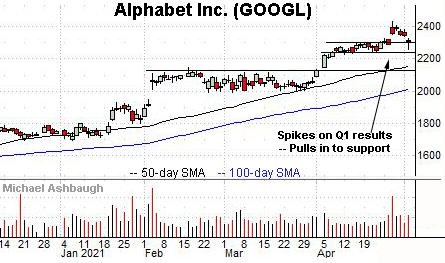
Moving to specific names, Alphabet, Inc. has pulled in from record highs, pressured at least partly amid renewed technology sector selling pressure. (Put differently, pressured amid a rotation away from growth, and toward cyclicals.)
The prevailing downturn has filled last month’s gap, placing the shares near the breakout point, circa 2,300, and 5.4% under the April peak. (Support technically rests at 2,299.90.)
Delving deeper, the ascending 50-day moving average has marked an inflection point and is rising toward the former range bottom (2,242). A sustained posture higher signals a comfortably bullish bias.
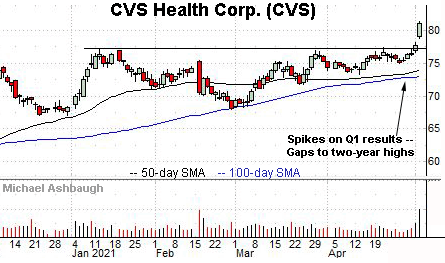
Initially profiled last week, CVS Health Corp. has broken out. (Yield = 2.5%.)
Specifically, the shares have knifed to two-year highs, rising after the company’s strong first-quarter results, aided partly by vaccination traffic. The prevailing upturn punctuates a modified head-and-shoulders bottom.
Though near-term extended, and due to consolidate, the strong-volume spike is longer-term bullish.
Tactically, the top of the gap (78.75) is followed by the firmer breakout point (77.00).
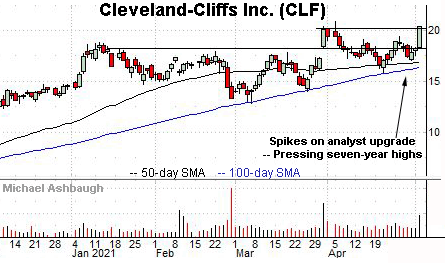
Cleveland-Cliffs, Inc. is a large-cap integrated steel producer coming to life.
Technically, the shares have knifed to the range top, tagging a seven-year closing high after an analyst upgrade.
The upturn punctuates a consecutive strong-volume spike — (also see the late-March gap higher, fueled by the company’s upwardly revised quarterly guidance) — positioning the shares for a potentially more decisive breakout.
An intermediate-term target projects to the 24 area on follow-through.
More broadly, the 100-day moving average has underpinned recent price action.
Finally, PNC Financial Services Group, Inc. is a well positioned large-cap regional bank.
Late last month, the shares rallied to record highs, rising from a relatively tight two-month range.
The subsequent bull flag — the tight one-week range — has been punctuated by this week’s strong-volume follow-through.
Tactically, the prevailing range bottom (186.10) is followed by the firmer breakout point (181.40). A sustained posture higher signals a bullish bias.


