Charting an Introduction
Focus: Emerging Markets' breakout attempt, IBM digests earnings-fueled spike, EEM, IBM, NUE, VMW, QRVO
This is the first edition of Charting Markets by Michael Ashbaugh, formerly the founder and editor of The Technical Indicator.
Updates can be directly accessed at chartingmarkets.substack.com.
Moving directly to the technicals, the major U.S. benchmarks seem to be concluding April — and the best six-month seasonal period — against a still comfortably bullish bigger-picture backdrop.
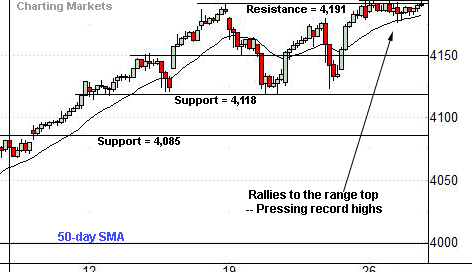
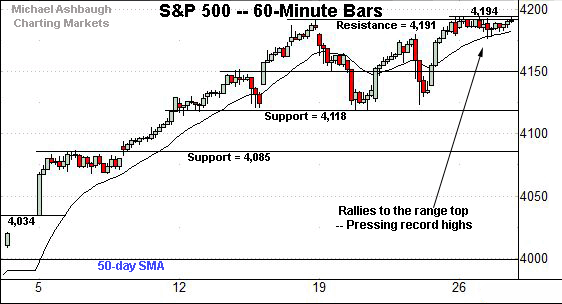
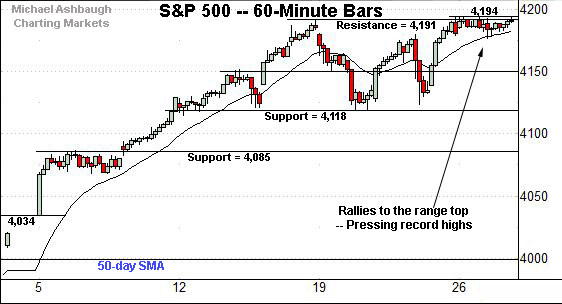
Before detailing the U.S. markets’ wider view, the S&P 500’s hourly chart highlights the past four weeks.
As illustrated, the S&P is pressing record territory. The index tagged a nominal record high (4,194) Monday, and has since held tightly to the range top. Bullish price action.
More broadly, the prevailing upturn punctuates a two-week range — a flag-like pattern — hinged to the steep early-April breakout.
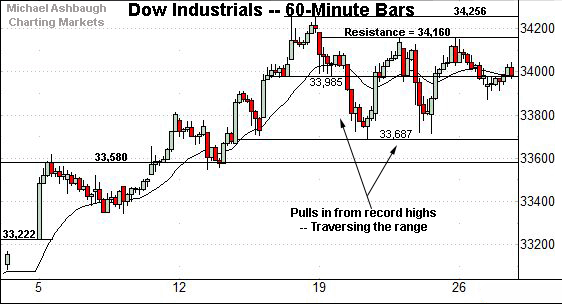
Meanwhile, the Dow Jones Industrial Average is not pressing record highs.
Still, the index has asserted a relatively orderly two-week range.
Tactically, the range top (34,160) is followed by the Dow’s record close (34,200) and absolute record peak (34,256).
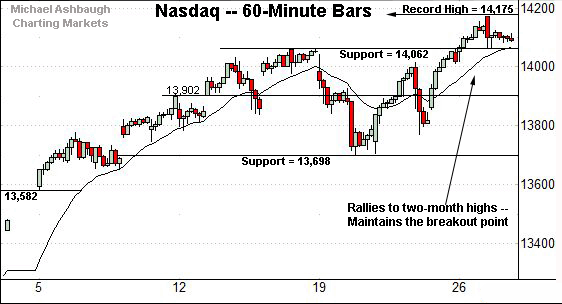
Against this backdrop, the Nasdaq Composite has sustained a break to two-month highs.
Consider that the week-to-date peak (14,171) registered slightly under the Nasdaq’s all-time high (14,175) established Feb. 16.
Conversely, the breakout point pivots to support (14,062), an area the Nasdaq has initially maintained.
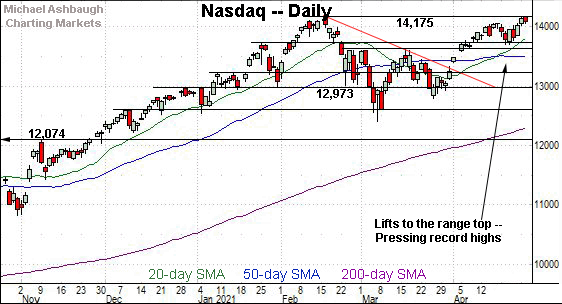
Widening the view to six months adds perspective.
On this wider view, the Nasdaq has rallied to its range top, rising to challenge all-time highs.
To reiterate, the week-to-date peak (14,171) has registered nominally under the Nasdaq’s record peak (14,175) established just over two months ago.
Conversely, the prevailing range bottom, circa 13,700, is followed by the March peak (13,620) and the flatlining 50-day moving average, currently 13,508. A sustained posture atop this area signals a comfortably bullish intermediate-term bias.
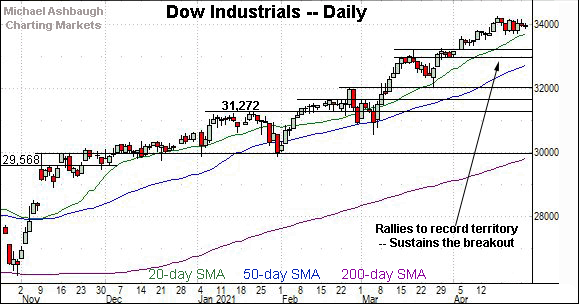
Looking elsewhere, the Dow Jones Industrial Average is digesting a mid-April rally to record highs.
The prevailing flag-like pattern — the flattish late-April pullback — signals still muted selling pressure, improving the chances of eventual upside follow-through.
Tactically, the range bottom (33,687) is followed by a deeper floor, circa 33,580. (Also see the hourly chart.)
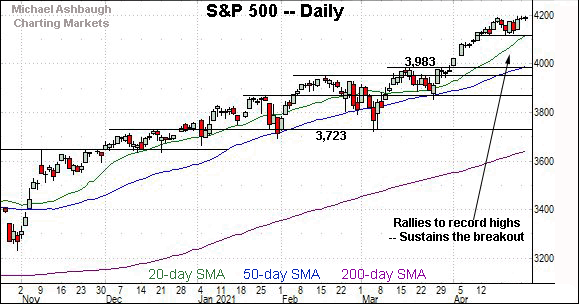
Meanwhile, the S&P 500 continues to challenge record territory.
Consider that three straight session highs have registered within one point of the S&P’s all-time high (4,194.19) established Monday. A breakout attempt is underway. (Also see the hourly chart.)
The bigger picture
As detailed above, the major U.S. benchmarks are acting well technically.
On a headline basis, the S&P 500 and Nasdaq Composite have challenged record highs this week, while the Dow industrials remain range-bound, consolidating slightly under record territory.
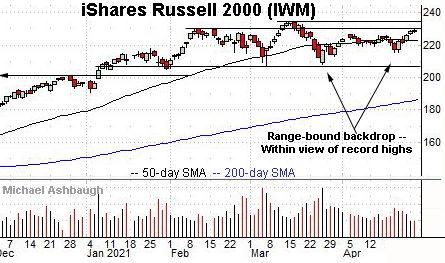
Moving to the small-caps, the iShares Russell 2000 is pressing its former range top, an area matching the Feb. peak (230.30).
Eventual follow-through atop resistance likely opens the path to a retest of the small-cap benchmark’s record high (234.53).
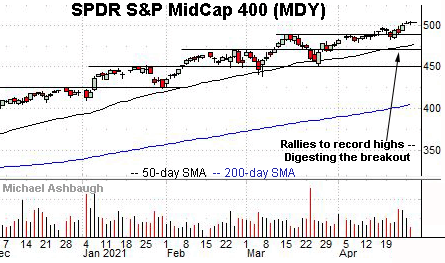
Meanwhile, the SPDR S&P MidCap 400 remains incrementally stronger.
In fact, the MDY has tagged a nominal record high across four straight sessions. The prevailing grinding-higher follow-through is technically constructive.
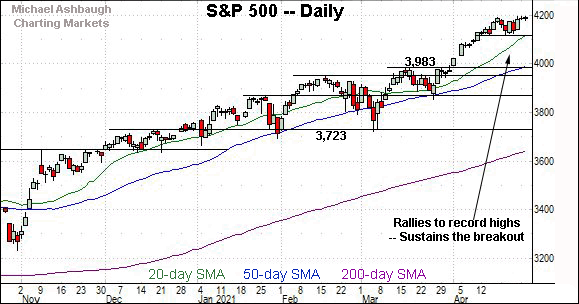
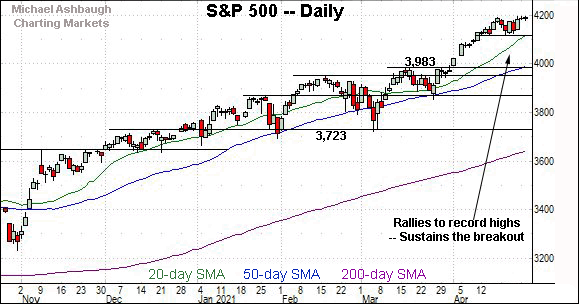
Placing a finer point on the S&P 500, a slow-motion breakout attempt remains underway.
Recall that three straight session highs have registered within one point of the S&P’s all-time high (4,194.19) established Monday.
More immediately, the index has tagged a nominal new record high early Wednesday.
Tactically, the prevailing range bottom (4,118) is followed by the S&P’s former projected target (4,085).
Delving deeper, the S&P’s 50-day moving average, currently 3,992, is closely followed by the early-April breakout point (3,983).
Broadly speaking, a sustained posture atop this area signals a comfortably bullish intermediate-term bias.
Beyond specific levels, the U.S. sub-sector price action remains rotational, on balance, also supporting a bullish bias. The response to the Federal Reserve’s policy directive, due out this afternoon, will likely add color.
Wednesday’s Watch List
Drilling down further, consider the following sectors and individual names:
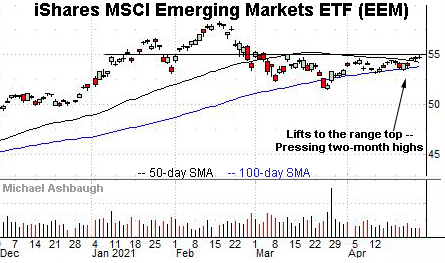
To start, the iShares MSCI Emerging Markets ETF is showing signs of life.
As illustrated, the shares are challenging two-month highs. Resistance spans from about 55.05 to 55.30.
More broadly, the prevailing upturn punctuates an inverse head-and-shoulders pattern, of sorts, defined by the March and April lows. An intermediate-term target projects to the 58 area on follow-through.
Conversely, the 100-day moving average, currently 53.80, has underpinned the April price action. A breakout attempt is in play barring a violation.
International Business Machines Corp. is a well positioned Dow 30 component. (Yield = 4.6%.)
Earlier this month, the shares gapped to 52-week highs, rising after the company’s first-quarter results. The ensuing pullback has been flat, fueled by decreased volume, positioning the shares to build of the initial spike.
Tactically, the top of the gap (136.70) closely matches the breakout point. A posture atop this area signals a comfortably-bullish bias.
Nucor Corp. is a well positioned large-cap steel name. (Yield = 2.0%.)
As illustrated, the shares have asserted a relatively orderly April range, digesting the aggressive March spike to 12-year highs.
Against this backdrop, the shares have weathered last week’s brief strong-volume downturn following the company’s first-quarter earnings miss. The nearly immediate strong-volume reversal to the range top signals bullish momentum is intact.
Tactically, a sustained posture atop gap support (74.45) signals a bullish bias.
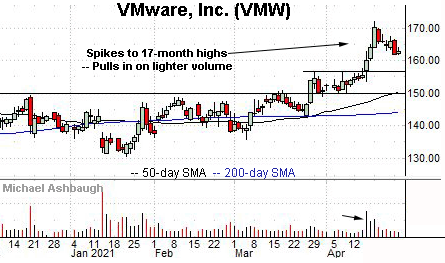
VMware, Inc. is a well positioned large-cap name.
Earlier this month, the shares knifed to 17-month highs, rising after Dell Technologies announced plans to spin off its 81% equity ownership stake, making VMware independent from its former parent company.
The subsequent pullback has been flattish, placing the shares 5.7% under the April peak. Tactically, a sustained posture atop the breakout point (156.60) signals a bullish bias.
Finally, Qorvo, Inc. is a well positioned large-cap semiconductor name.
Technically, the shares have rallied to the range top, rising to challenge record highs. An intermediate-term target projects to the 217 area on follow-through.
Conversely, the prevailing upturn punctuates a successful test of the former range top, an area closely matching the 50-day moving average. The prevailing uptrend is intact barring a violation.
Note that the company’s quarterly results are due out May 5.

