Charting successful technical tests: S&P 500, Dow industrials maintain major support
Focus: Gold miners sustain trendline breakout, Home Depot and Pepsico trend higher, GDX, HD, PEP
Technically speaking, the U.S. markets’ rally attempt is intact, though amid persistently uneven price action.
Against this backdrop, the S&P 500 and Dow Jones Industrial Average have maintained major support — S&P 3,900 and Dow 33,240 — areas that remain bull-bear inflection points.
Editor’s Note: As always, updates can be directly accessed at https://chartingmarkets.substack.com.
Before detailing the U.S. markets’ wider view, the S&P 500’s hourly chart highlights the past four weeks.
As illustrated, the S&P continues to digest the November breakout.
Tactically, the breakout point (3,900) has underpinned the prevailing pullback, and is followed by familiar gap support (3,860).
Similarly, the Dow Jones Industrial Average has sustained its November breakout.
Notably, the Dow’s recent pullback has been underpinned by major support (33,240) an area also detailed on the daily chart.
Last week’s low (33,239) matched major support.
Slightly more broadly, the prevailing upturn punctuates a successful test of the 200-day moving average, currently 32,488.
Against this backdrop, the Nasdaq Composite remains comparably weaker than the other benchmarks.
Nonetheless, the index is holding the upper half of its one-month range.
Tactically, the post-breakout low (10,999) has matched the 11,000 mark.
Slightly more broadly, the Nasdaq has sustained a break atop its 50-day moving average, an area also detailed below.
Widening the view to six months adds perspective.
On this wider view, the Nasdaq has struggled to sustain a break atop familiar resistance (11,220). Recall the 11,220 area, established after the Federal Reserve’s September policy statement.
Delving deeper, the Nasdaq is digesting a rally atop the 11,000 mark and the 50-day moving average, currently 10,920. Tactically, the Nasdaq’s recovery attempt is intact barring a violation of the 10,920-to-11,000 area.
Looking elsewhere, the Dow Jones Industrial Average remains strikingly stronger.
As illustrated, the index has extended a rally atop the 200-day moving average, rising within striking distance of six-month highs.
Moreover, the subsequent flag pattern — the tight November range — has been underpinned by major support (33,240), detailed previously.
To reiterate, last week’s low (33,239) effectively matched major support. Bullish price action.
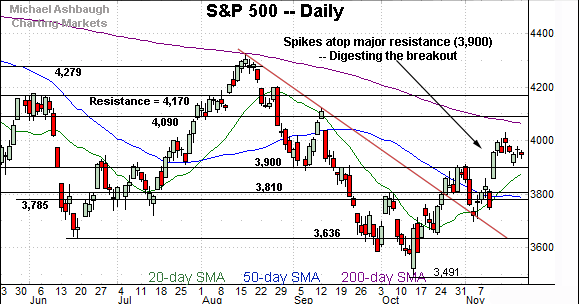
Meanwhile, the S&P 500 is digesting a rally to two-month highs.
The prevailing pullback has been orderly, and underpinned by the breakout point (3,900).
Here again, last week’s low (3,906) roughly matched major support.
The bigger picture
As detailed above, the major U.S. benchmarks have sustained November rally attempts, though a pronounced market divergence remains in play. (The Dow industrials continue to outperform as the Nasdaq Composite lags firmly behind.)
Against this backdrop, the S&P 500 and Dow industrials have closely observed major support — the S&P 3,900 and Dow 33,240 areas.
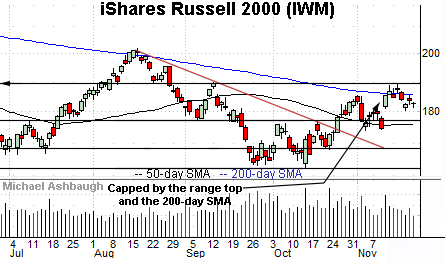
Moving to the small-caps, the iShares Russell 2000 ETF (IWM) has asserted a holding pattern, of sorts.
Within the range, the small-cap benchmark remains capped by its 200-day moving average, currently 185.62, and the three-month range top (189.90).
Meanwhile, the SPDR S&P MidCap 400 ETF (MDY) remains slightly stronger than the Russell 2000.
As illustrated, the mid-cap benchmark has sustained a slight break atop the 200-day moving average, though the September peak has marked a sticking point.
Slightly more broadly, the MDY has asserted a bull flag, the tight range, hinged to the strong-volume November breakout.
Tactically, the 200-day moving average, currently 451.20, is closely followed by gap support (449.80). A sustained posture atop this area signals a bullish bias.
Returning to the S&P 500, the index has asserted a holding pattern, digesting the November breakout.
As detailed previously, the breakout point (3,900) marks a significant floor.
Last week’s low (3,906) registered nearby, amid a successful retest.
Delving deeper, the 50-day moving average, currently 3,788, matches major support in the 3,785-to-3,810 area.
Tactically, the S&P 500’s recovery attempt is intact barring a violation of the 3,800 area. More broadly, the S&P 500’s longer-term bias remains bearish pending more extensive repairs.
Watch List
Drilling down further, the VanEck Gold Miners ETF (GDX) has come to life, rising amid gold’s resurgence detailed last week. (Yield = 2.2%.)
The group initially spiked two weeks ago, knifing atop trendline resistance to tag four-month highs.
More immediately, the prevailing pullback has been fueled by decreased volume, placing the group 4.8% under the November peak. Tactically, a sustained posture atop the breakout point (25.10) signals a firmly-bullish bias.
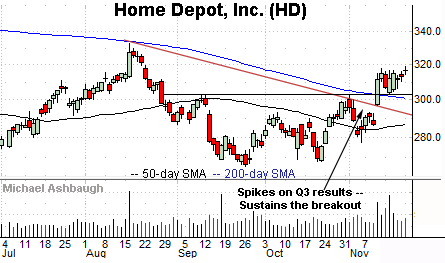
Moving to specific names, Home Depot, Inc. (HD) is a well positioned Dow 30 component. (Yield = 2.4%.)
Earlier this month, the shares knifed atop trendine resistance, rising after the company’s third-quarter results. The subsequent flag-like pattern positions the shares to build on the strong-volume breakout.
Tactically, the breakout point (302.20) is closely followed by the 200-day moving average, currently 300.80. The prevailing rally attempt is intact barring a violation.
(Also see the head-and-shoulders bottom defined by the August, September and November lows.)
Finally, PepsiCo, Inc. (PEP) is a large-cap name taking flight. (Yield = 2.5%.)
As illustrated, the shares have tagged all-time highs, rising from a relatively tight one-month range. A near-term target projects to the 188.50 area.
Conversely, the breakout point (182.90) is closely followed by the former range top (181.00). A sustained posture atop this area signals a firmly-bullish bias.


