S&P 500 extends bear-market rally as market rotation persists
Focus: 10-year Treasury yield pulls in to 50-day average, U.S. dollar extends November downturn amid gold's trendline breakout, TNX, UUP, GLD
Technically speaking, the major U.S. benchmarks have extended a November rally attempt amid price action that gets mixed marks for style.
On a headline basis, the Dow Jones Industrial Average continues to outperform — amid market rotation — while the Nasdaq Composite lags firmly behind. The charts below add color:
Editor’s Note: As always, updates can be directly accessed at https://chartingmarkets.substack.com.
Before detailing the U.S. markets’ wider view, the S&P 500’s hourly chart highlights the past four weeks.
As illustrated, the S&P has broken out, rising to tag the 4,000 mark.
Tactically, the breakout point (3,900) pivots to major support, and is followed by the top of last week’s gap (3,860).
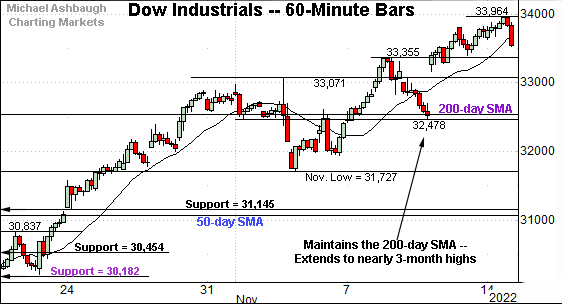
Meanwhile, the Dow Jones Industrial Average remains incrementally stronger.
Recent upside follow-through punctuates a successful test of the 200-day moving average, currently 32,528.
This is the only major U.S. benchmark positioned atop its 200-day moving average.
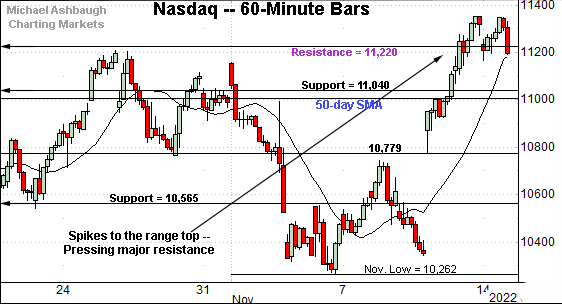
True to recent form, the Nasdaq Composite continues to lag behind.
Nonetheless, the index has knifed to its range top, rising to challenge major resistance (11,220).
The 11,220 area is also illustrated below, established after the Federal Reserve’s September policy statement.
(The levels detailed in purple correspond — Nasdaq 11,220, Dow 30,180 and S&P 3,790 — reflecting the Nasdaq’s underperformance.)
Widening the view to six months adds perspective.
On this wider view, the Nasdaq is challenging a two-month range top (11,220).
The prevailing upturn places it atop the 50-day moving average, currently 11,003. Three consecutive closes have registered atop the 50-day, a widely-tracked intermediate-term trending indicator.
More broadly, the prevailing upturn punctuates a double bottom defined by the October and November lows.
Tactically, the Nasdaq’s recovery attempt is intact barring a violation of the 11,000 area.
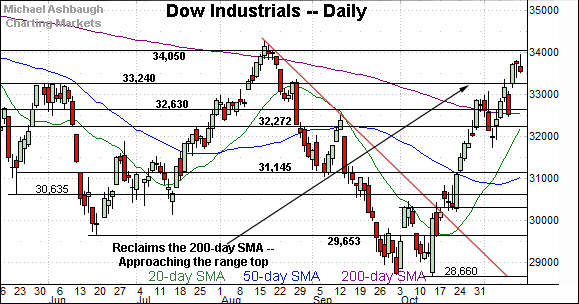
Looking elsewhere, the Dow Jones Industrial Average remains strikingly stronger.
As illustrated, the index has extended a break atop the 200-day moving average — a widely-tracked longer-term trending indicator — rising within view of six-month highs.
On further strength, major resistance (34,050) is closely followed by the August closing peak (34,152) and the absolute August peak (34,281).
More broadly, the nearly straightline spike from the October low — and comparably flattish pullbacks — are technically constructive.
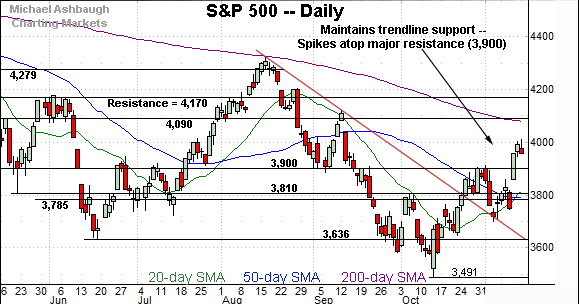
Meanwhile, the S&P 500 has knifed to two-month highs.
The prevailing upturn places it atop the 50-day moving average and the former breakdown point (3,900).
Recent follow-through originates from a successful test of trendline support.
The bigger picture
As detailed above, each major U.S. benchmark has extended a November rally attempt, though the bigger-picture backdrop is not one-size-fits all.
On a headline basis, the Dow industrials continue to outperform — by a wide margin, amid market rotation — while the Nasdaq Composite lags behind.
Moving to the small-caps, the iShares Russell 2000 ETF (IWM) has reached a headline technical test.
Specifically, the shares are challenging the 200-day moving average, currently 186.05, rising amid recently increased volume.
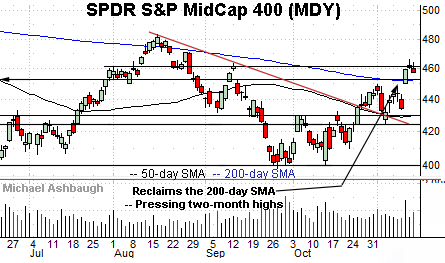
Meanwhile, the SPDR S&P MidCap 400 ETF (MDY) has strengthened slightly versus the Russell 2000.
As illustrated, the shares have reclaimed the 200-day moving average, rising to challenge the September peak.
Also recall the small- and mid-caps stabilized before the major benchmarks at the October low.
The recent backdrop is consistent with market rotation, price action extending across asset classes, as detailed in the next section.
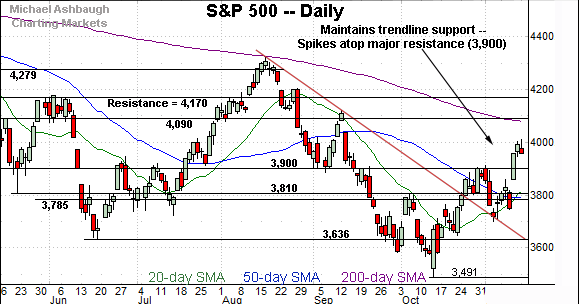
Returning to the S&P 500, the index has knifed to two-month highs.
The prevailing upturn originates from trendline support.
Delving deeper, the 50-day moving average, currently 3,794, matches major support in the 3,785-to-3,810 area, detailed previously.
Broadly speaking, the S&P 500’s recovery attempt is intact barring a violation of the 3,800 area. Beyond near-term issues, the bigger-picture backdrop remains bearish pending more extensive repairs.
(On a granular note, though the market internals have improved, they have not registered prints consistent with a stake-in-the-ground cornerstone reversal, sufficient to define the market low. They’re not even very close in the current market context. Time will tell whether the internals strengthen as the recovery attempt progresses.)
Watch List
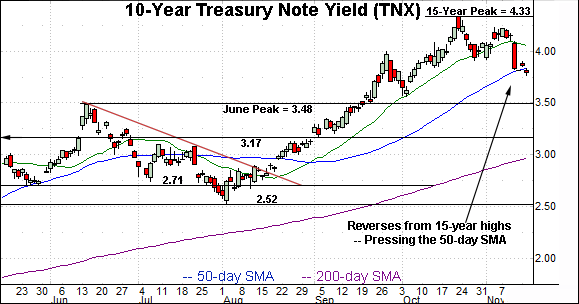
Drilling down further, the 10-year Treasury note yield (TNX) has reversed course, easing amid recently tamer-than-expected inflation data.
Against this backdrop, the yield is retesting its 50-day moving average, currently 3.83. The yield has not closed under its 50-day since mid-August, an event roughly corresponding with the S&P 500’s mid-August peak.
Tactically, the prevailing downturn marks a sideways consolidation phase, potentially mirroring the July-through-August chop.
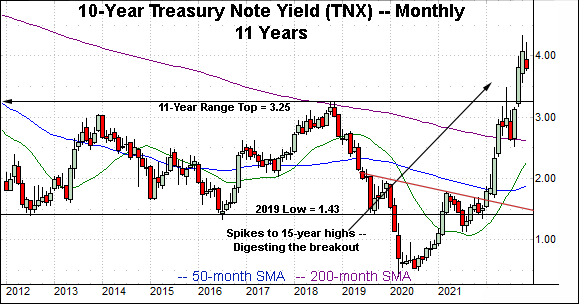
More broadly, the yield is digesting a massive 2022 spike — illustrated on the monthly chart — after briefly tagging its highest level since November 2007.
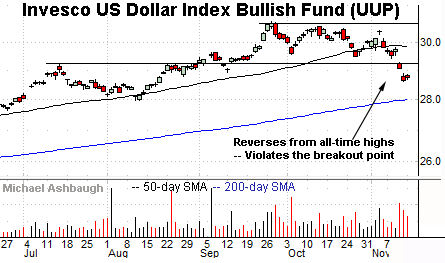
Meanwhile, the Invesco U.S. Dollar Index Bullish Fund (UUP) — a U.S. dollar proxy — has also turned lower.
Fundamentally, easing interest rates (yields) make a native currency (in this case the dollar) less attractive versus competing currencies, generally sending it lower. The softer dollar presents a tailwind for U.S. multinationals, making exports less expensive.
Technically, the dollar has violated its 50-day moving average, as well as the September breakout point (28.10). This area pivots to resistance.
More broadly, the U.S. dollar is digesting a massive 2022 breakout, fueled by a sustained volume increase, illustrated on the eight-year chart. (The dollar may have experienced a flight-to-safety bid as institutions parked money, or reallocated, amid an otherwise broadly-based market downturn.)
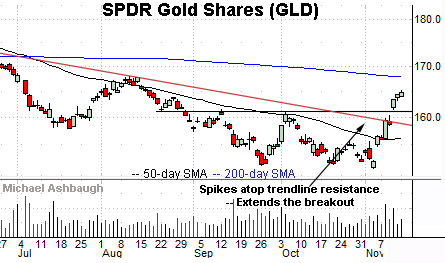
Conversely, the SPDR Gold Shares ETF (GLD) has taken flight. As always, gold and the U.S. dollar are inversely correlated.
Technically, gold has staged a strong-volume trendline breakout, punctuating a double bottom defined by the September and November lows.
From current levels, the breakout point — the 161.10-to-161.60 area — pivots to support. A sustained posture higher signals a bullish intermediate-term bias.
(Separately, bitcoin has been pressured of late — amid recent crypto drama — an added gold tailwind as both gold and bitcoin are perceived as dollar alternatives.)
(Elsewhere, the Japanse yen has also turned higher, staging a comparable trendline breakout to gold’s, consistent with a risk-on trade.)
Summing up the backdrop
Combined, the charts above broadly support the intermediate-term the bull case. Material cross currents across asset classes signal a potential shift in market structure. Still, the trends detailed are worth tracking for sustainability, or lack thereof. Swift reversals back across key levels would be cause to reasses the bull case.


