Charting slow-motion breakouts: S&P 500, Nasdaq clear major resistance
Focus: Emerging markets press key trendline, EEM, PEP, TTWO, AMBA, CVLT, NEM
Technically speaking, the major U.S. benchmarks seem to be concluding a volatile month of May on a bullish note.
Consider that the S&P 500 and Nasdaq Composite have registered modest breaks atop key resistance — S&P 4,191 and Nasdaq 13,620 — and the immediate selling pressure has thus far been muted. Constructive price action.
Editor’s Note: As always, updates can be directly accessed at chartingmarkets.substack.com.
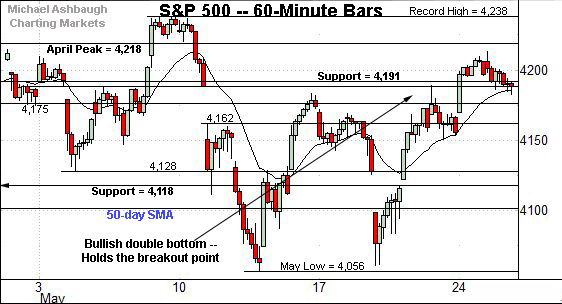
Before detailing the U.S. markets’ wider view, the S&P 500’s hourly chart highlights the past four weeks.
As illustrated, the S&P has sustained a slight break from its double bottom, the W formation defined by the May lows.
The immediate pullback has been flat, underpinned by first support in the 4,188-to-4,191 area, detailed previously. Constructive price action.
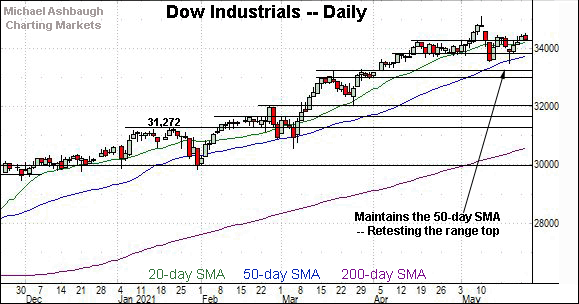
Meanwhile, the Dow Jones Industrial Average is pressing a two-week range top.
Tactically, eventual follow-through would punctuate a double bottom — defined by the May lows — opening the path to less-charted territory.
Conversely, familiar support matches the April peak (34,256).
Against this backdrop, the Nasdaq Composite has sustained a slight break atop key resistance.
The specific area matches the March peak (13,620), an intermediate-term bull-bear inflection point detailed repeatedly. Constructive price action.
(Recall the S&P 500’s corresponding rally atop the 4,191 resistance, and flattish pullback.)
Widening the view to six months adds perspective.
On this wider view, the Nasdaq has sustained a bullish reversal atop the 50-day moving average and the March peak. The prevailing upturn originates from a nearly 8-to-1 up day on the Nasdaq’s initial rally from the 13,000 mark.
More immediately, this week’s follow-through atop major resistance (the 50-day, and 13,620) signals a bullish-leaning shift to the intermediate-term bias.
As detailed previously, overhead inflection points match the Jan. peak (13,729), the early-May gap (13,795) and the post-breakdown peak (13,828).
Looking elsewhere, the Dow industrials’ backdrop remains comparably straightforward.
Technically, the index has rallied respectably from the 50-day moving average, rising to sustain a slight break atop the April peak (34,256).
Additional overhead matches the Dow’s two-week range top (34,454). Eventual follow-through opens the path to a less-charted patch, and potential retest of record highs.
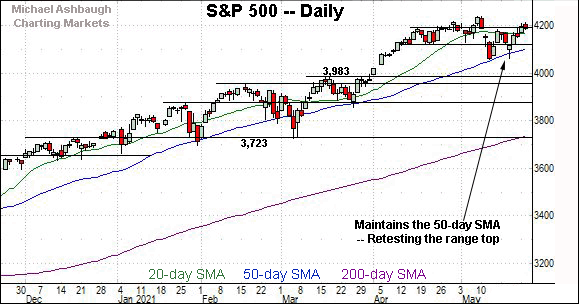
Meanwhile, the S&P 500 has rallied from consecutive tests of the 50-day moving average, currently 4,105.
More immediately, an extended test of the range top — the 4,191 area — remains underway.
The bigger picture
As detailed above, the major U.S. benchmarks seem to be concluding a volatile month of May on a bullish note.
On a headline basis, the S&P 500 and Dow industrials continue to challenge two-week range tops, rising within striking distance of record territory.
Meanwhile, the still lagging Nasdaq Composite has nonetheless sustained a slight break atop key resistance (13,620).
Collectively, each big three U.S. benchmark’s intermediate-term bias remains bullish.
Drilling down on the S&P 500
Placing a finer point on the S&P 500, the index has sustained a modest late-May breakout.
Recall the prevailing upturn punctuates a double bottom — the W formation — defined by the May lows.
By comparison, the immediate pullback has been flat, and underpinned by support in the 4,188-to-4,191 area. Bullish price action.
More broadly, the S&P 500’s pulling-teeth breakout attempt effectively remains underway.
Recall that a sustained break atop the 4,191 area opens the path to a less-charted patch. On further strength, the S&P’s record close (4,232.60) is closely followed by the absolute record peak (4,238.04).
Slightly more broadly, a near- to intermediate-term target projects from the S&P’s double bottom to the 4,310 area. This matches a former target — the 4,308-to-4,318 area, detailed May 10 — though based on a different projection.
Beyond specific levels, the S&P 500 seems to have weathered a May volatility spike. Its intermediate-term bias remains bullish based on today’s backdrop.
Editor’s Note: This is the last review until Tuesday. The U.S. markets are closed Monday, May 31 for Memorial Day.
Watch List
Drilling down further, consider the following sectors and individual names:
To start, the iShares MSCI Emerging Markets ETF is showing signs of life technically.
Specifically, the shares are challenging trendline resistance hinged to the February peak. The prevailing upturn originates from major support matching a six-month range bottom.
Tactically, a breakout attempt is in play barring a violation of near-term support, circa 53.50.
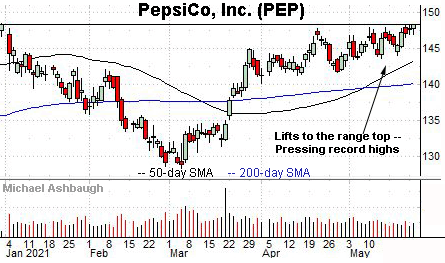
PepsiCo, Inc. is a well positioned large-cap name. (Yield = 2.9%.)
As illustrated, the shares have rallied to the range top, rising to challenge record highs. (The week-to-date peak (148.39) has registered just under Pepsi’s all-time high (148.77), established Dec. 2020.)
Recent persistence near the range top improves the chances of eventual follow-through. Tactically, a breakout attempt is in play barring a violation of the May range bottom (143.50).
More broadly, the shares are well positioned on the five-year chart, holding relatively tightly to resistance matching the 2020 peak.
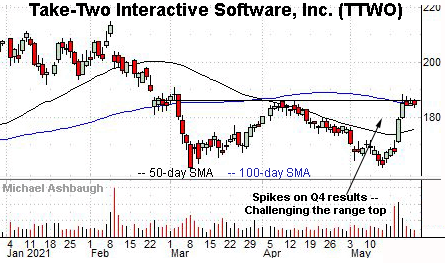
Take-Two Interactive Software, Inc. is a well positioned large-cap video game developer.
As illustrated, the shares have recently staged a strong-volume rally, rising to the range top (186.20) after the company’s quarterly results. The upturn punctuates a double bottom defined by the March and May lows.
More immediately, this week’s tight range signals muted selling pressure, improving the chances of eventual follow-through. Tactically, a breakout attempt is in play barring a violation of near-term support, circa 183.50.
Ambarella, Inc. is a mid-cap semiconductor name coming to life.
Technically, the shares are challenging trendline resistance roughly matching the 50-day moving average, currently 98.30. A breakout attempt is in play barring a violation of the former range bottom (94.10).
Note the company’s quarterly results are due out June 1, after the close.
Commvault Systems, Inc. is a well positioned mid-cap software vendor.
As illustrated, the shares have knifed to seven-year highs, clearing a well-defined range top.
Though near-term extended, and due to consolidate, the sustained strong-volume rally is longer-term bullish. Tactically, the breakout point (71.70) pivots to support.
More broadly, the shares are well positioned on the 15-year chart, rising from a massive double bottom defined by the 2016 and 2019 lows.
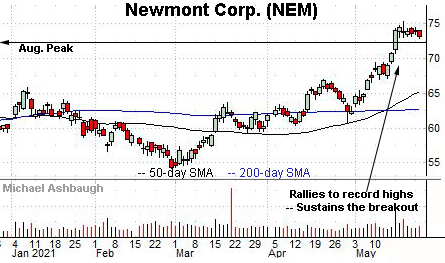
Finally, large-cap gold miner Newmont Corp. has asserted a flag pattern at record highs.
Major support matches the 2020 peak (72.22) and 2011 peak (72.42). A sustained posture higher signals a firmly-bullish bias.
Editor’s Note: This is the last review until Tuesday. The U.S. markets are closed Monday, May 31 for Memorial Day.


