Charting signs of stabilization, Nasdaq challenges key trendline
Focus: Metals & mining sector sustains breakout, XME, ANF, AVID, KGC
Technically speaking, the major U.S. benchmarks continue to whipsaw amid a persistent May volatility spike.
Against this backdrop, the Nasdaq Composite is vying to stabilize — in the wake of a damaging May downdraft — rising to retest a key trendline and notable near-term resistance (13,460).
Editor’s Note: As always, updates can be directly accessed at chartingmarkets.substack.com. Your smartphone can also access updates at the same address, chartingmarkets.substack.com.
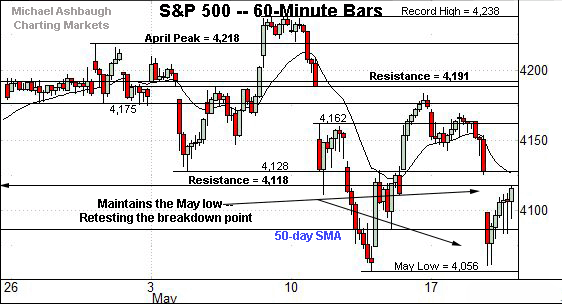
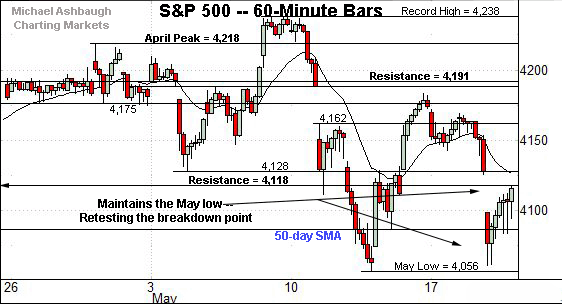
Before detailing the U.S. markets’ wider view, the S&P 500’s hourly chart highlights the past four weeks.
As illustrated, the S&P continues to whipsaw amid jagged May price action.
Tactically, the week-to-date low (4,061) has registered slightly atop the May low (4,056.9) to punctuate a successful retest.
The S&P has subsequently rallied to retest the breakdown point (4,118) from underneath.
Wednesday’s session high (4,117) closely matched the breakdown point, and the index is firmly higher early Thursday.
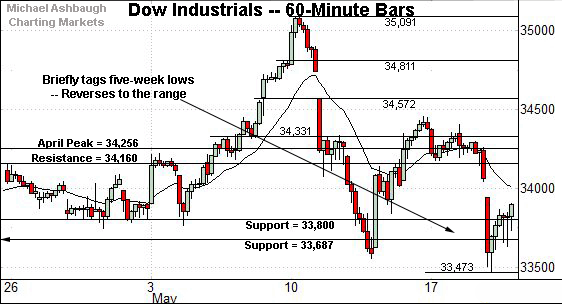
Meanwhile, the Dow Jones Industrial Average has briefly tagged a five-week low.
Still, the index reversed respectably Wednesday, rising to close within a familiar range.
Tactically, gap resistance — at 33,945 and 34,044 — is followed by the former range top (34,160).
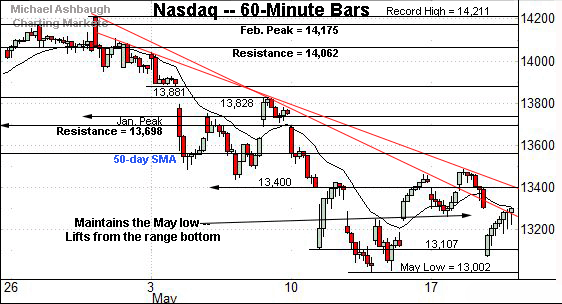
Against this backdrop, the Nasdaq Composite remains the weakest major benchmark.
Nonetheless, the index has registered a second bullish reversal from the May low (13,002).
Tactically, notable resistance spans from 13,404 to 13,429, levels matching the early-April gap and last week’s close. A three-week trendline matches this area.
Slightly more distant overhead matches the post-breakdown peak (13,460).
So collectively, follow-through atop the 13,430-to-13,460 area would raise the flag to a near-term trend shift.
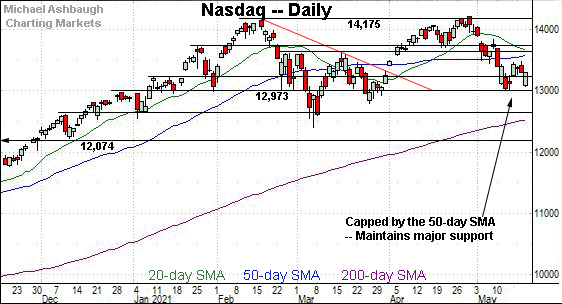
Widening the view to six months adds perspective.
On this wider view, the Nasdaq is vying to stabilize in the wake of a sharp May downturn.
Though the 13,000 mark has underpinned the downturn, material upside follow-through has thus far been elusive.
To reiterate, an eventual rally atop the 13,430-to-13,460 area would raise the flag to a near-term trend shift.
More distant inflection points match the 50-day moving average, currently 13,573, and the March peak (13,620). The Nasdaq’s intermediate-term bias remains bearish pending follow-through atop this area.
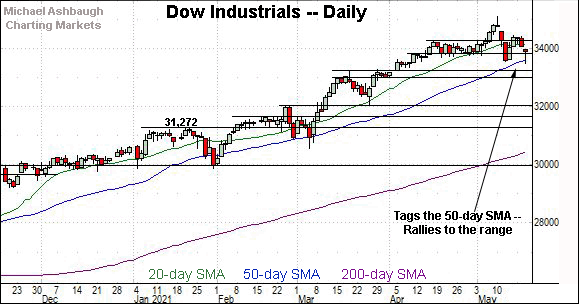
Looking elsewhere, the Dow Jones Industrial Average has weathered a mid-May volatility spike.
This week’s successful test of the 50-day moving average, currently 13,618, has been punctuated by a bullish reversal to the former range. (See the bull hammer.)
Tactically, overhead inflection points match the former range top (34,160) and the April peak (34,256).
Beyond the details, the Dow’s intermediate-term bias remains bullish.
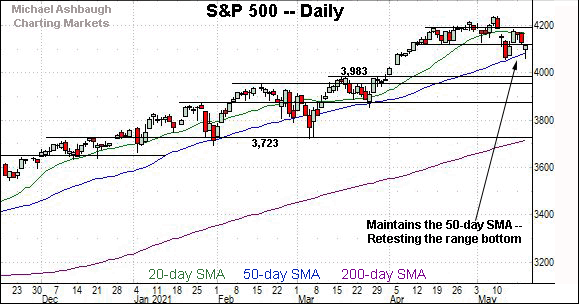
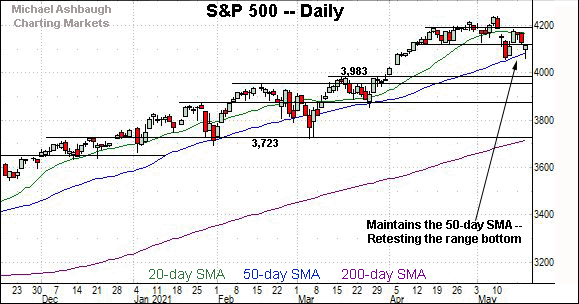
Meanwhile, the S&P 500 has weathered a second recent test of the 50-day moving average, currently 4,086.
The index subsequently reversed to the former range bottom (4,118).
Wednesday’s session high (4,117) effectively matched resistance (4,118), and the S&P has followed through to its former range early Thursday.
The bigger picture
Collectively, the U.S. benchmarks’ bigger-picture backdrop remains uneven amid an increasingly familiar market divergence.
Amid the volatility, the S&P 500 and Dow industrials have retained a bullish intermediate-term bias.
Meanwhile, the Nasdaq Composite’s intermediate-term bias remains bearish-leaning. Eventual follow-through atop the 13,460 area would mark technical progress, opening the path to potentially more important tests at the 50-day moving average and the March peak (13,620).
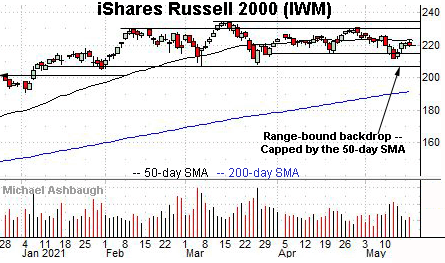
Moving to the small-caps, the iShares Russell 2000 ETF remains range-bound.
Within the range, the 50-day moving average, currently 222.90, remains an inflection point.
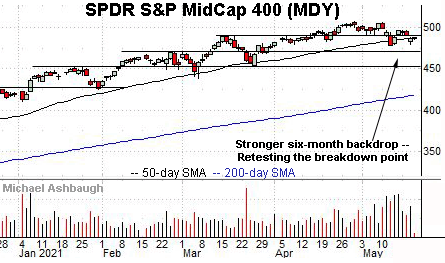
Meanwhile, the SPDR S&P MidCap 400 remains comparably stronger.
Tactically, the 50-day moving average, currently 487.60, is closely followed by the breakdown point (489.50).
Slightly more broadly, recent rally attempts have been fueled by increased volume.
Placing a finer point on the S&P 500, the index has whipsawed across nearly three weeks. An unusually tight late-April range preceded the May volatility spike.
Tactically, the week-to-date low (4,061) has registered slightly atop the May low (4,056.9) to punctuate a successful retest.
The subsequent bullish reversal initially stalled at the breakdown point (4,118). The S&P has followed through atop resistance early Thursday, rising to its former range.
More broadly, the S&P 500 has weathered a second recent test of the 50-day moving average, currently 4,086.
The nearly immediate reversal to the breakdown point (4,118) — and follow-through to the former range — are technically constructive.
Tactically, the May low (4,057) marks a more notable inflection point after consecutive tests. An eventual violation would mark a “lower low” — combined with a violation of the 50-day moving average — raising a caution flag.
Likely last-ditch support continues to match the early-April breakout point (3,983). Broadly speaking, the S&P 500’s intermediate-term bias remains bullish barring a violation of the 3,980 area.
Editor’s Note: The next review will be published Monday.
Watch List
Drilling down further, consider the following sectors and individual names:
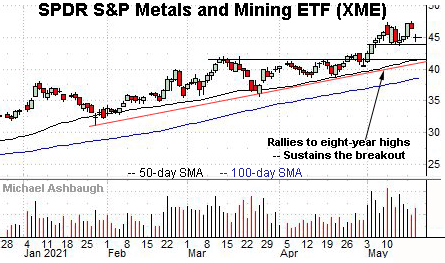
Initially profiled May 4, the SPDR S&P Metals & Mining ETF remains well positioned.
Earlier this month, the group knifed to eight-year highs, rising from an ascending triangle hinged to the January low. The subsequent flag-like pattern positions the shares to extend the uptrend.
Tactically, the prevailing range bottom (43.75) is followed by the breakout point (41.50) and trendline support closely tracking the 50-day moving average. The prevailing uptrend is firmly-intact barring a violation.
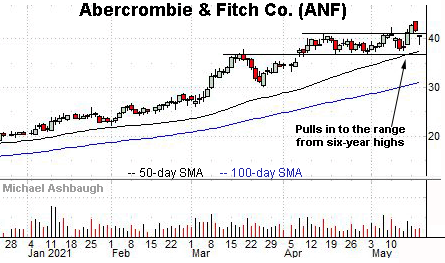
Moving to specific names, Abercrombie & Fitch Co. is a well positioned mid-cap retailer.
The shares started this week with a breakout, reaching six-year highs. The upturn punctuates a tight one-month range amid recent strong-volume rallies.
More immediately, the prevailing pullback has been reasonably shallow — despite a down market — placing the shares 5.7% under the May peak.
Tactically, a sustained posture atop the prevailing range bottom (36.95) signals a bullish bias.
Note the company’s quarterly results are due out May 26.
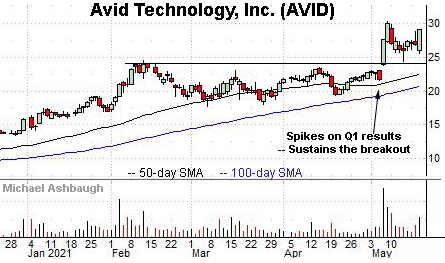
Avid Technology, Inc. is a mid-cap developer of video and audio software solutions.
Earlier this month, the shares knifed to 13-year highs, rising after the company’s quarterly results.
The ensuing pullback has been comparably flat — underpinned by the breakout point (23.90) — positioning the shares to build on the initial spike.
Tactically, a sustained posture atop near-term support, circa 27.40, signals a comfortably bullish bias.
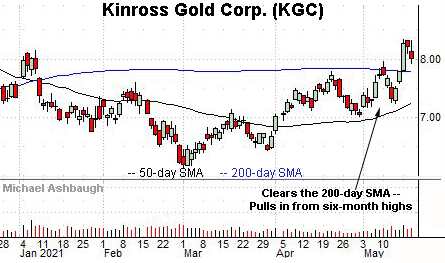
Finally, Kinross Gold Corp. is a large-cap Toronto-based gold miner. (Yield = 1.5%.)
Technically, the shares have recently knifed to six-month highs, clearing the 200-day moving average amid increased volume.
The subsequent pullback places the shares 4.1% under the May peak.
Tactically, the 200-day moving average, currently 7.78, roughly matches near-term support. The prevailing rally attempt is intact barring a violation.
More broadly, notice the pending golden cross, or bullish 50-day/200-day moving average crossover.
Editor’s Note: The next review will be published Monday.


