Charting a double bottom, S&P 500 clears major resistance
Focus: Crude oil presses 52-week highs, Applied Materials clears key trendline, USO, AMAT, STX, NTAP, TMST
U.S. stocks are slightly lower early Tuesday, pressured modestly after a soft batch of economic data.
Against this backdrop, the S&P 500 has briefly tagged two-week highs — atop major resistance (4,191) — while the Nasdaq Composite digests a key trendline breakout.
Editor’s Note: As always, updates can be directly accessed at chartingmarkets.substack.com.
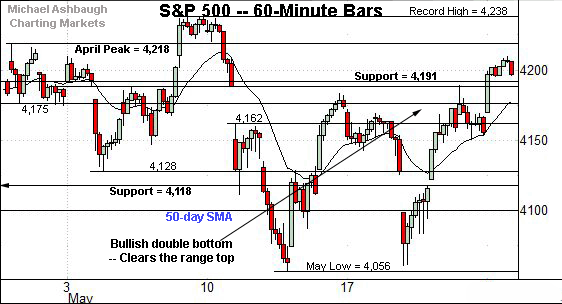
Before detailing the U.S. markets’ wider view, the S&P 500’s hourly chart highlights the past four weeks.
As illustrated, the S&P has cleared its range top, reaching two-week highs.
The breakout punctuates a double bottom — the W formation — defined by the May lows. Tactically, the 4,188-to-4,191 area pivots to first support.
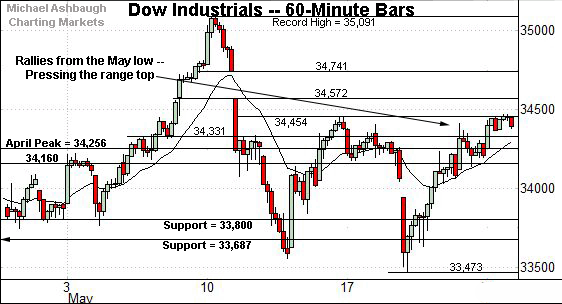
Meanwhile, the Dow Jones Industrial Average is pressing a two-week range top.
Tactically, eventual follow-through would punctuate a double bottom — defined by the May lows — opening the path to less-charted territory.
On further strength, see gap resistance at 34,572 and 34,741.
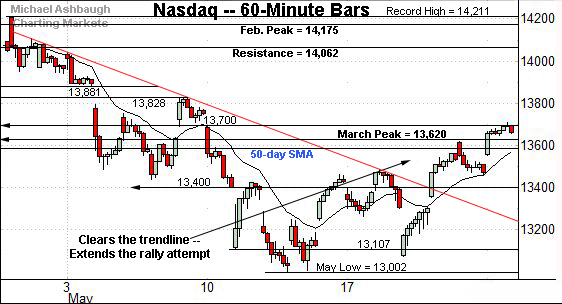
Against this backdrop, the Nasdaq Composite has extended its trendline breakout.
This week’s follow-through places it atop the March peak (13,620), an intermediate-term bull-bear inflection point detailed repeatedly. Constructive price action.
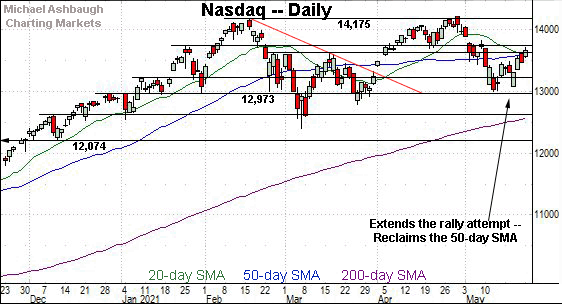
Widening the view to six months adds perspective.
On this wider view, the Nasdaq has extended a bullish reversal from the 13,000 area.
The prevailing upturn places it atop the 50-day moving average, currently 13,590, and the March peak (13,620), a bull-bear fulcrum, detailed previously.
Still, several inflection points remain just overhead. To reiterate, the Jan. peak (13,729) is followed by the early-May gap (13,795) and the post-breakdown peak (13,828).
Looking elsewhere, the Dow industrials’ backdrop remains comparably straightforward.
Technically, the prevailing late-May upturn punctuates a successful test of the 50-day moving average.
More immediately, the index has reclaimed the April peak (34,256), rising to challenge a two-week range top (34,454). (See the hourly chart.)
Eventual follow-through opens the path to a less-charted patch, and a potential retest of record highs.
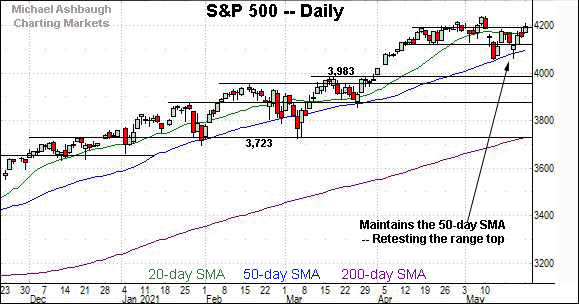
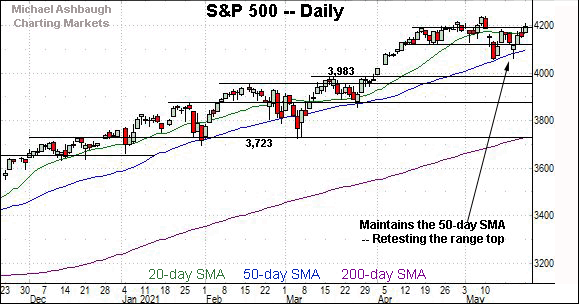
Meanwhile, the S&P 500 has rallied from consecutive tests of the 50-day moving average, currently 4,100.
Tactically, Monday’s close (4,197) registered slightly above the range top (4,191). The S&P is vying Tuesday to register a consecutive close higher.
The bigger picture
Collectively, the U.S. benchmarks’ bigger-picture backdrop continues to strengthen. At least on the margin.
On a headline basis, the Nasdaq Composite has extended a trendline breakout, reclaiming the 50-day moving average and major resistance (13,620).
Meanwhile, the S&P 500 and Dow industrials are pressing a two-week range top, a backdrop placing each index within striking distance of record highs. (See the hourly charts.)
Beyond the details, each big three U.S. benchmark’s intermediate-term bias remains bullish.
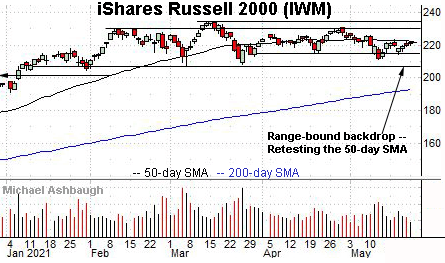
Moving to the small-caps, the iShares Russell 2000 ETF continues to effectively flatline.
An extended test of the 50-day moving average, currently 222.17, remains underway.
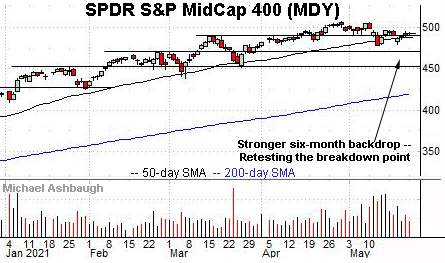
Perhaps not surprisingly, the SPDR S&P MidCap 400 remains comparably stronger.
Tactically, the MDY has sustained a modest rally atop its breakdown point (489.50), notching three straight closes nominally higher.
Placing a finer point on the S&P 500, the index seems to be concluding May on a bullish note.
This week’s follow-through punctuates a double bottom — the W formation — defined by the May lows.
Tactically, the 4,188-to-4,191 area pivots to notable support.
More broadly, the S&P 500 has reached a less-charted patch, to the extent it sustains the rally atop resistance (4,191).
On further strength, the S&P’s record close (4,232.60) is closely followed by the absolute record peak (4,238.04).
Slightly more broadly, a near- to intermediate-term target projects from the S&P’s double bottom to the 4,310 area. This matches a former target — the 4,308-to-4,318 area, detailed May 10 — though based on a different projection.
Beyond specific levels, all trends technically point higher, as it applies to the S&P 500, based on today’s backdrop.
Watch List
Drilling down further, consider the following sectors and individual names:
To start, the United States Oil Fund is showing signs of life technically. The fund tracks the spot price of light, sweet crude oil.
As illustrated, the shares have rallied toward the range top, rising to press 52-week highs.
The prevailing upturn punctuates a relatively tight May range. A near-term target projects to the 49 area on follow-through.
Conversely, the former breakout point (43.50) is followed by the 50-day moving average and the May low (42.30). A sustained posture higher signals a bullish intermediate-term bias.
Moving to specific names, Applied Materials is a large-cap chip equipment name coming to life.
As illustrated, the shares have knifed atop trendline resistance, rising after the company’s quarterly results released last week. The prevailing upturn punctuates a successful test of the 100-day moving average.
Tactically, trendline support, circa 128, is followed by the former breakout point (124.50). The prevailing rally attempt is intact barring a violation.
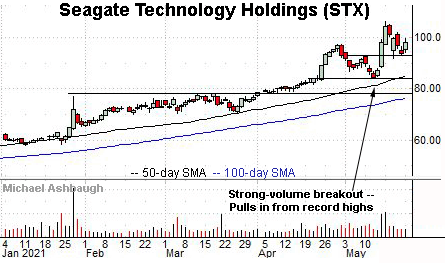
Seagate Technology Corp. is a well positioned large-cap developer of data storage solutions. (Yield = 2.7%.)
Earlier this month, the shares knifed to record highs, rising after a positive analyst note regarding Seagate’s capacity to benefit from the growth of an emerging cryptocurrency.
The subsequent pullback has been fueled by decreased volume, placing the shares 8.2% under the May peak. Tactically, a sustained posture atop near-term support, circa 93.40, signals a comfortably bullish bias.
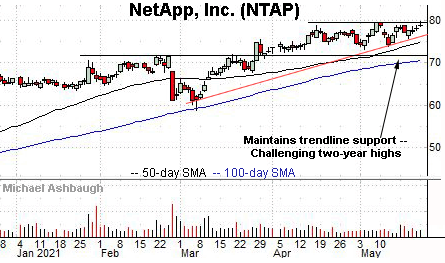
NetApp, Inc. is another well positioned large-cap data storage name. (Yield = 2.4%.)
Technically, the shares have rallied to the range top, briefly tagging two-year highs.
The prevailing upturn punctuates a tight six-week range, and successful test of trendline support. A near-term target projects to the 85 area.
More broadly, the shares are well positioned on the five-year chart, pressing an inflection point matching the 2019 peak.
Note the company’s quarterly results are due out June 2.
Finally, TimkenSteel Corp. is a well positioned small-cap name.
Earlier this month, the shares staged a bull-flag breakout, ultimately reaching nearly three-year highs. The subsequent pullback places the shares 10.0% under the May peak.
Tactically, trendline support closely matches the breakout point (13.45). The prevailing uptrend is firmly-intact barring a violation.


