Charting a technical breakout (of sorts), S&P 500 challenges major resistance
Focus: Transports challenge 200-day average, Gold miners sustain breakout, Emerging markets and Intel Corp. show signs of life
Technically speaking, the major U.S. benchmarks have extended a thus far lukewarm January rally attempt.
Amid the upturn, the S&P 500 has tagged three-week highs, though it has yet to close atop major resistance, an area matching the 3,900 mark.
Editor’s Note: As always, updates can be directly accessed at https://chartingmarkets.substack.com.
Before detailing the U.S. markets’ wider view, the S&P 500’s hourly chart highlights the past four weeks.
As illustrated, the S&P has come to life technically.
Still, while the index briefly tagged three-week highs, it has not yet closed atop the 3,900 mark, an area matching the 50-day moving average, currently 3,907. Broadly speaking, a retest of the 3,900 area remains in play.
(On a granular note, the S&P has technically sustained a breakout — atop the 3,878 area — though the 3,900 mark remains a more significant inflection point, as detailed on the daily chart.)
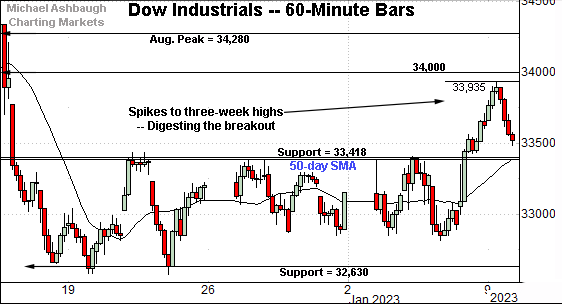
True to recent form, the Dow Jones Industrial Average remains the strongest major benchmark.
As illustrated, the index has sustained a more aggressive break to three-week highs.
Tactically, the 50-day moving average, currently 33,411, closely matches the breakout point (33,418), an area detailed previously. (See the Jan. 4 review.)
Tuesday’s early session low (33,421) has registered nearby amid a successful retest. Constructive price action.
Against this backdrop, the Nasdaq Composite has also broken out.
The prevailing upturn places it atop major resistance (10,565) an inflection point detailed repeatedly.
Last week’s close (10,569) registered nearby, and the index has followed through higher. This area pivots to support.
(Recall the 2023 open (10,562) also closely matched the 10,565 inflection point.)
Widening the view to six months adds perspective.
On this wider view, the Nasdaq has turned higher, rising to briefly tag three-week highs. Nonetheless, the prevailing backdrop doesn’t exactly scream “raging bull.”
On further strength, the 50-day moving average, currently 10,862, is closely followed by the December breakdown point (10,910). Follow-through atop this area would mark technical progress.
Conversely, the breakout point (10,565) pivots to support, as detailed previously.
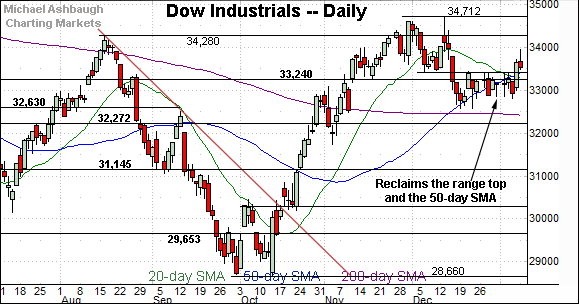
Looking elsewhere, the Dow Jones Industrial Average continues to outpace the other benchmarks.
The prevailing upturn places it back atop the 50-day moving average, currently 33,410, as well as resistance broadly spanning from about 33,240 to 33,420. (Also see the hourly chart.)
More broadly, this is the only major benchmark positioned atop its 200-day moving average (in purple), an area that has underpinned the recent pullback.
Market bulls will point to a developing cup-and-handle defined by the October and December lows (as well as the August and November peaks).
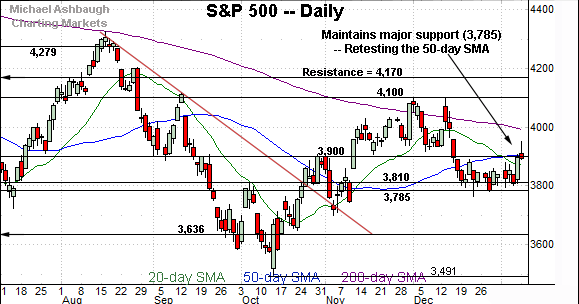
Meanwhile, the S&P 500 has rattled its range top.
Tactically, a retest of the 3,900 resistance and the 50-day moving average, currently 3,907, remains underway.
Slightly more broadly, the prevailing upturn originates from major support (3,785) detailed previously.
The bigger picture
As detailed above, the major U.S. benchmarks have extended a January rally attempt.
In the process, each big three U.S. benchmark has tagged three-week highs, rising amid breakouts that get mixed marks for style.
Tactically, the pending retest of each benchmark’s breakout point should be a useful bull-bear gauge. (See the hourly charts.)
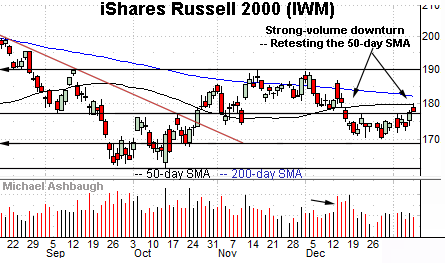
Moving to the small-caps, the iShares Russell 2000 ETF (IWM) has ticked higher to start January.
Tactically, the 50-day moving average, currently 179.78, is followed by the not-too-distant 200-day moving average, currently 182.00.
The small-cap benchmark has struggled to place material distance atop the 200-day moving average going back as far as November 2021. The pending retest from underneath may add color.
Meanwhile, the SPDR S&P MidCap 400 ETF (MDY) remains slightly stronger than the Russell 2000.
As illustrated, the MDY has reclaimed its breakdown point (449.50), an area roughly matching the 50- and 200-day moving averages.
Combined, the small- and mid-caps have registered less-than-inspiring January breakouts. At least based on today’s backdrop.
Returning to the S&P 500, the index has reached a notable technical test.
Consider that last week’s close (3,895) registered just under resistance (3,900) to punctuate Friday’s respectable, though not off-the-charts, 5-to-1 up day. (Advancing volume surpassed declining volume by a 5-to-1 margin.)
The index subsequently slipped three points to start this week.
So an extended test of the 3,900 mark — and the 50-day moving average — remains underway. Sustained follow-through atop this area would signal a bullish-leaning intermediate-term bias.
More broadly, the S&P 500’s longer-term bias remains bearish based on today’s backdrop. Tactically, the 200-day moving average, currently 3,990, continues to match trendline resistance on the weekly chart, detailed previously. (See the Jan. 4 review.)
To reiterate, eventual follow-through atop the 3,990-to-4,000 area would signal a potentially consequential trend shift.
Watch List
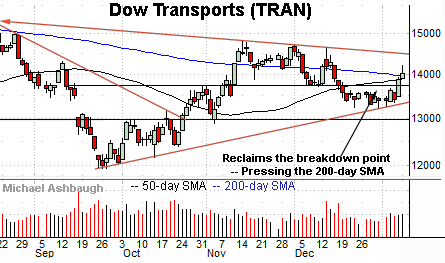
Drilling down further, the Dow Transports (TRAN) have reached a notable technical test.
As illustrated, the group has reclaimed its breakdown point (13,718), rising to challenge the 50- and 200-day moving averages. These are widely-tracked trending indicators, and a sustained break higher would strengthen the bull case.
On further strength, follow-through atop trendline resistance — currently the 14,500 area — would more firmly signal a trend shift.
Tactically, trendline support is rising toward the former breakdown point (13,718). A sustained posture atop this area signals a bullish-leaning intermediate-term bias.
Meanwhile, the VanEck Gold Miners ETF (GDX) has broken out.
Specifically, the group has knifed to seven-month highs, clearing the 200-day moving average on increased volume.
Though near-term extended, and due to consolidate, the strong January start is longer-term bullish. Tactically, the breakout point (30.00) pivots to support.
Slightly more broadly, notice the pending golden cross or bullish 50-day/200-day moving average crossover.
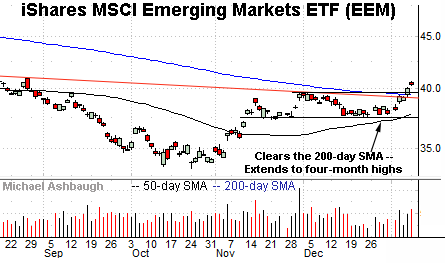
Beyond the U.S., the iShares MSCI Emerging Markets ETF (EEM) has come to life technically.
As illustrated, the shares have tagged four-month highs, clearing trendline resistance and the 200-day moving average. The breakout raises the flag to a longer-term trend shift.
Tactically, breakout point (39.55) closely matches the 200-day moving average, currently 39.45. The prevailing rally attempt is intact barring a violation.
Finally, Intel Corp. (INTC) is a Dow 30 component showing signs of life. (Yield = 5.3%.)
As illustrated, the shares have cleared trendline resistance, a level recently tracking the 100-day moving average. The slight breakout raises the flag to a potential trend shift.
Tactically, the trendline pivots to support and is closely followed by the 50-day moving average, currently 28.32, a recent bull-bear inflection point. The prevailing recovery attempt is intact barring a violation.
(On a granular note, Intel is rising from a “higher low” — see the Dec. low versus the Oct. low — also consistent with a broader trend shift.)


