Charting the approach of Dow 35,000
Focus: Retail sector challenges record territory, Oracle's breakout attempt, XRT, BBY, ORCL, RGLD, IRM
U.S. stocks are mixed early Monday, vacillating as a May divergence persists.
Against this backdrop, the Dow Jones Industrial Average extended its breakout — tagging the 35,000 mark for the first time on record — while the Nasdaq Composite continues to retest its 50-day moving average.
Editor’s Note: As always, updates can be directly accessed at chartingmarkets.substack.com.
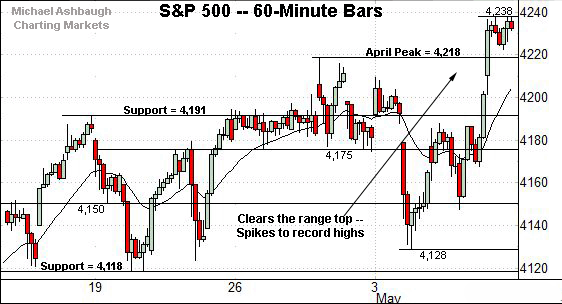
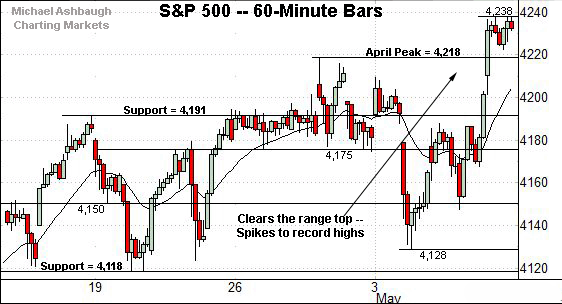
Before detailing the U.S. markets’ wider view, the S&P 500’s hourly chart highlights the past four weeks.
As illustrated, the S&P has spiked to record territory. Tactically, overhead targets project to the 4,265 and 4,308-to-4,318 areas, detailed previously.
Conversely, the breakout point (4,218) marks first support.
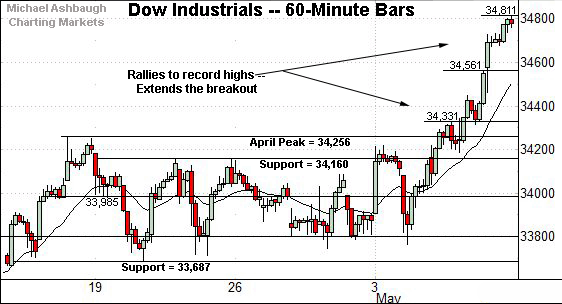
Meanwhile, the Dow Jones Industrial Average has extended its breakout, knifing from a nearly one-month range.
Tactically, near-term floors are not well-defined. Delving deeper, the Dow’s breakout point (34,256) marks the first notable support.
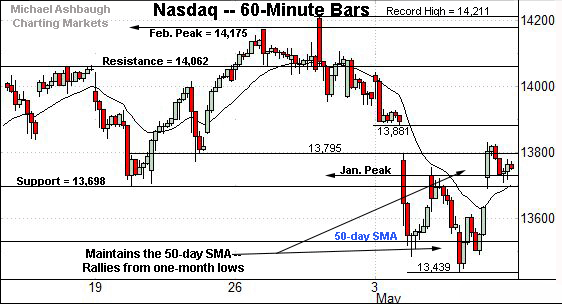
True to recent form, the Nasdaq Composite remains the weakest major benchmark.
As illustrated, the index staged a lukewarm rally attempt, from one-month lows, thus far capped by gap resistance (13,795).
Against this backdrop, an extended retest of the 50-day moving average, currently 13,536, remains underway early Monday.
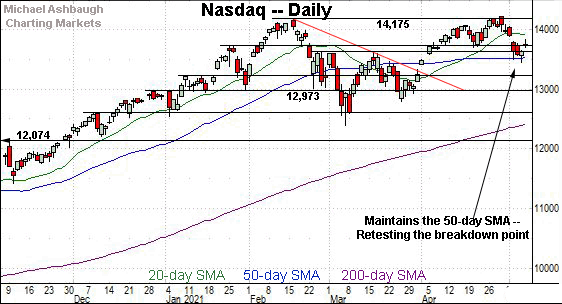
Widening the view to six months adds perspective.
On this wider view, the Nasdaq has struggled to sustain a rally atop its breakdown point in the 13,700-to-13,730 area. (Also see the hourly chart.)
Last week’s close (13,752) registered slightly higher, though the index is firmly on the defensive early Monday.
Tactically, the 50-day moving average, currently 13,536, is followed by the May low (13,439). An eventual violation would raise a caution flag amid a developing double top.
Looking elsewhere, the Dow Jones Industrial Average has taken flight.
The prevailing upturn marks a bullish two standard deviation breakout, encompassing consecutive closes atop the 20-day Bollinger bands. (Bands not illustrated.)
As always, consecutive closes atop the bands signal a near-term extended posture — due at least a sideways chopping-around phase — against a firmly-bullish longer-term backdrop.
More immediately, the Dow has tagged the 35,000 mark for the first time on record early Monday.
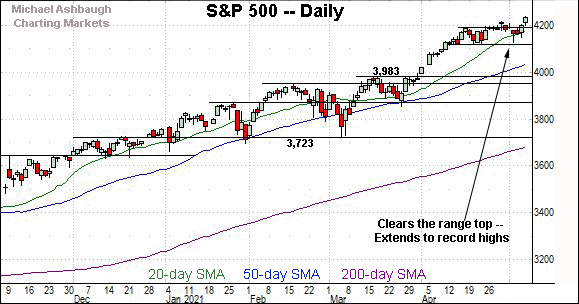
Meanwhile, the S&P 500 has registered a respectable, though less decisive, technical breakout.
Tactically, the breakout point (4,218) is followed by the former range top (4,191).
The bigger picture
Collectively, the major U.S. benchmarks remain in divergence mode amid persistently uneven May price action.
Specifically, the S&P 500 and Dow industrials have tagged all-time highs, even as the Nasdaq Composite continues to challenge its 50-day moving average.
Each benchmark’s intermediate-term bias remains bullish, based on today’s backdrop, though the Nasdaq’s downturn is worth tracking for potential technical damage.
Moving to the small-caps, the iShares Russell 2000 ETF remains range-bound.
The small-cap benchmark has not strayed too far from its 50-day moving average, currently 223.44, across about six weeks.
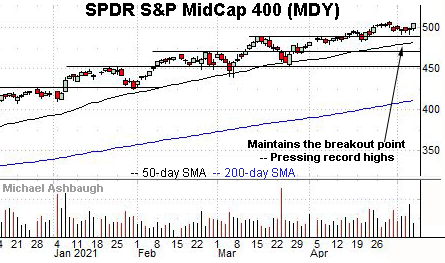
Perhaps not surprisingly, the SPDR S&P MidCap 400 remains comparably stronger.
The MDY has maintained its breakout point, circa 489.50, rising within view of record highs.
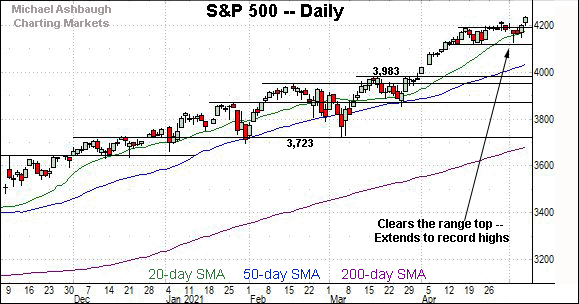
Placing a finer point on the S&P 500, the index has knifed to record highs.
The upturn punctuates a jagged May start. Tactically, the breakout point (4,218) is followed by the former range top (4,191).
More broadly, the breakout punctuates a nearly one-month range spanning precisely 100 points — from 4,118 to 4,218.
Tactically, a former target, around 4,265, is followed by a more distant projection to the 4,308-to-4,318 area.
Beyond the details, all technical trends continue to point higher as it applies to the S&P 500.
(On a granular note, the S&P has registered a single close atop the 20-day volatility bands (not illustrated) and is vying Monday for the more reliably bullish consecutive closes atop the bands.)
Monday’s Watch List
Drilling down further, consider the following sectors and individual names:
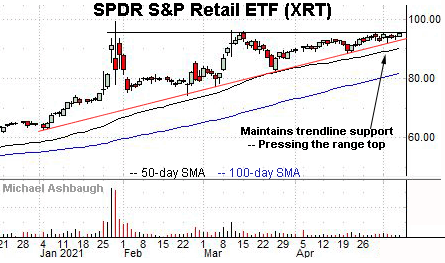
To start, the SPDR S&P Retail ETF is acting well technically.
As illustrated, the group is pressing its range top, rising to tag a nominal record close.
The prevailing upturn punctuates a tight two-week range — underpinned by trendline support — laying the groundwork for potentially decisive follow-through. An intermediate-term target projects to the 107 area.
Tactically, trendline support is closely followed by the ascending 50-day moving average, currently 90.42. A sustained posture higher signals a bullish intermediate-term bias.
Moving to specific names, Best Buy Co., Inc. is a well positioned large-cap electronics retailer. (Yield = 2.3%.)
Technically, the shares have rallied to the range top, rising to challenge record highs.
The prevailing upturn punctuates a shallow April pullback, underpinned by the 50-day moving average. A near-term target projects to the 129 area on follow-through.
A breakout attempt is underway early Monday.
Oracle Corp. is a well positioned large-cap name.
As illustrated, the shares have rallied to the range top, rising to tag consecutive record closes.
The prevailing upturn originates from a successful test of the March peak. A near-term target projects to the 84 area on follow-through.
Tactically, a breakout attempt remains in play barring a violation of near-term support, circa 78.50.
Royal Gold, Inc. is a large-cap miner coming to life.
As illustrated, the shares have reclaimed the 200-day moving average, rising to tag six-month highs. The prevailing upturn originates from the breakout point.
Tactically, the former range top is closely followed by the 200-day, currently 116.90. The prevailing rally attempt is intact barring a violation.
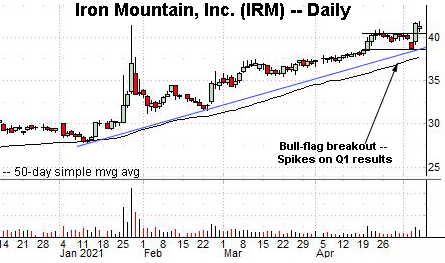
Finally, Iron Mountain, Inc. is a large-cap real estate investment trust (REIT) specializing in physical and digital storage.
Technically, the shares have staged a bull-flag breakout, briefly tagging record highs after the company’s first-quarter results.
The upturn places a multi-year range top under siege, detailed on the monthly chart. (See the 2015 peak (41.53), 2016 peak (41.50) and 2017 peak (41.53).)
Tactically, trendline support closely matches the former range bottom (38.60). A breakout attempt is in play barring a violation.


