Charting market rotation, small-caps stage powerful July breakout
Focus: Dow industrials also take flight as market rally broadens beyond large-cap tech
Technically speaking, the U.S. benchmarks’ mid-July price action has been punctuated by bullish, and likely consequential, market rotation.
In the process, the “Magnificent Seven” large-cap technology stocks — persistent market leaders — have been pressured in recent sessions, used as a source of funds deployed to other pockets of the market. The charts below add color:
Editor’s Note: As always, updates can be directly accessed at chartingmarkets.substack.com.
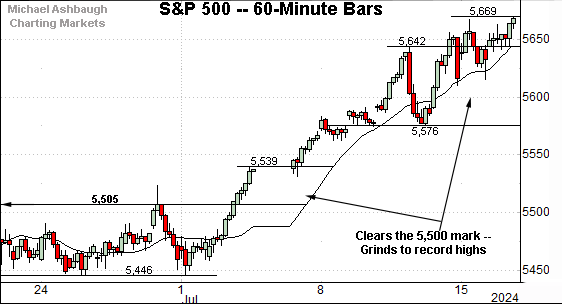
Before detailing the U.S. markets’ wider view, the S&P 500’s hourly chart highlights the past four weeks.
As illustrated, the S&P 500 has staged a grinding-higher July breakout.
Tactically, near-term support points are no so well-defined, though the 5,500 area stands out, as also detailed on the daily chart.
Meanwhile, the Dow Jones Industrial Average has taken flight, knifing to all-time highs.
The prevailing upturn punctuates a tight three-week range, recently underpinned by the 50-day moving average.
Here again, near-term support is currently not well-defined, though the 40,350 area and the 40,000 mark represent potential floors.
Against this backdrop, the Nasdaq Composite is digesting its latest rally to record territory.
Tactically, the 18,200 area is followed by the July breakout point (17,936) a level also illustrated below.
Widening the view to six months adds perspective.
On this wider view, the Nasdaq has asserted a steady near-term uptrend. From the April low (15,222) to the July peak (18,671), the index has climbed as much as 3,449 points, or 22.7%, across about 13 weeks.
Against this backdrop, trendline support loosely tracks the 20-day moving average, currently 18,076, and is followed by the July breakout point (17,936).
Tactically, a closing violation of this area (17,936) — which looks possible, amid recent market rotation — would raise the flag to a consolidation phase, and potentially deeper pullback. The Nasdaq’s longer-term bias remains comfortably bullish, based on today’s backdrop.
Looking elsewhere, the Dow Jones Industrial Average has broken out, rising nearly 1,000 points (or 2.5%) across just two sessions.
The breakout punctuates a nearly five-month range, of sorts, opening the path to potentially material incremental follow-through. An intermediate-term target projects from the range to the 42,170 area.
Separately, the prevailing upturn has registered as statistically powerful — a two standard deviation breakout — encompassing three straight closes atop the 20-day volatility bands (not illustrated). Though due to consolidate, recent strength improves the chances of intermediate-term follow-through.
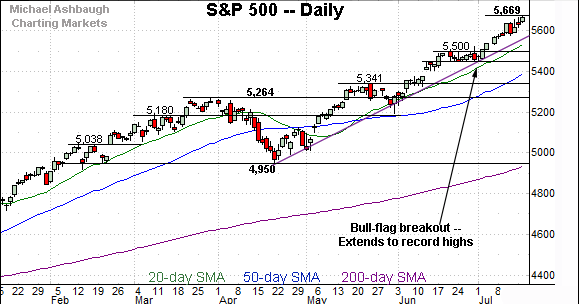
Meanwhile, the S&P 500 is trending more steadily higher.
From the April low (4,953) to the July peak (5,669), the index has climbed as much as 716 points, or 14.5%, across about 13 weeks.
Tactically, trendline support closely tracks the 20-day moving average, currently 5,536, and is followed by the July breakout point (5,500).
The bigger picture
As detailed above, the major U.S. benchmarks are broadly trending higher. Each big three benchmark has registered an all-time high within the past week.
But beyond the obvious, the mid-July price action has been punctuated by likely consequential market rotation.
More directly, the “Magnificent Seven” large-cap technology stocks — persistent market leaders — have been pressured in recent sessions, used as a source of funds deployed to other pockets of the market. Rotational beneficiaries have included (but are not limited to) the small-caps, the industrials and the financials.
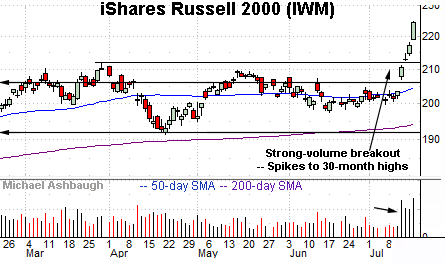
Speaking of the small-caps, the iShares Russell 2000 ETF (IWM) has taken flight, rising amid recently market-friendly inflation data, as well as shifting U.S. political expectations.
The breakout has been fueled by a sustained volume increase, placing the small-cap benchmark at 30-month highs.
Underlying the upturn, the July spike marks a statistically unusual two standard deviation breakout, encompassing four straight closes atop the 20-day volatility bands (not illustrated). As always, consective closes atop the bands signal powerful bullish momentum that is likely to follow-through higher following a consolidation phase.
More broadly, the prevailing upturn punctuates a head-and-shoulders bottom — detailed previously — defined by the March, April and May lows. (See the June 6 review.)
Meanwhile, the SPDR S&P MidCap 400 ETF (MDY) has also broken out, though less aggressively than the small-caps.
The upturn places the mid-cap benchmark at all-time highs. Tactically, the breakout point, circa 557, pivots to support.
(Though visually less striking than the Russell 2000’s spike, the MDY’s upturn nonetheless marks another two standard deviation breakout, encompassing four straight closes atop the 20-day volatility bands. The sequence starts with the recent gap atop the 50-day moving average.)
Returning to the S&P 500, its bigger-picture backdrop remains unusually straightforward.
To start, the index has staged a July breakout, grinding to record highs. Recent strength punctuates a bull flag, the tight late-June range.
Tactically, trendline support closely tracks the 20-day moving average, currently 5,536, and is followed by the July breakout point — the 5,500-to-5,505 area.
Delving deeper, the ascending 50-day moving average, currently 5,396, is followed by the May range top (5,341).
As always, it’s not just what the markets do, it’s how they do it.
But generally speaking, the S&P 500’s bigger-picture bias remains bullish barring a violation of the 5,340 area. Beyond technical levels, the recent rotational price action — and directionally steep breakouts, in spots — support a bullish broad-market view.
Also see June 25: Charting a strong bull trend, S&P 500 clears 20-day volatility bands.


