Charting a strong bull trend, S&P 500 clears 20-day volatility bands
Focus: Nasdaq and S&P 500 stage two standard deviation breakouts
Technically speaking, the S&P 500 and Nasdaq Composite continue to trend higher, rising amid statistically unusual momentum in spots.
Meanwhile, the Dow Jones Industrial Average has not broken out — at least not to record highs — as it continues to lag behind. The charts below add color:
Editor’s Note: As always, updates can be directly accessed at chartingmarkets.substack.com.
Before detailing the U.S. markets’ wider view, the S&P 500’s hourly chart highlights the past four weeks.
As illustrated, the S&P 500 has pulled in modestly from its record high, just above the 5,500 mark.
Tactically, initial support (5,450) is followed by inflection points matching the mid-June gap — the 5,375 and 5,400 areas.
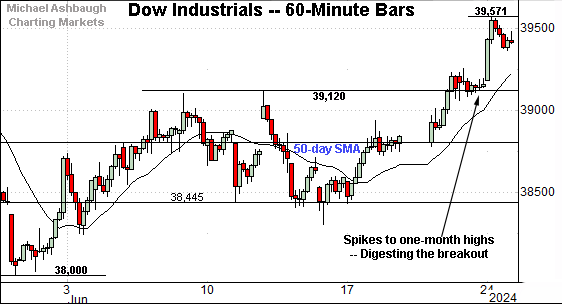
Meanwhile, the Dow Jones Industrial Average has knifed to one-month highs.
The prevailing upturn punctuates a relatively tight mid-June range — a coiled spring, of sorts — bisected by the 50-day moving average.
Tactically, the breakout point (39,120) is followed by the 50-day moving average, currently 38,790.
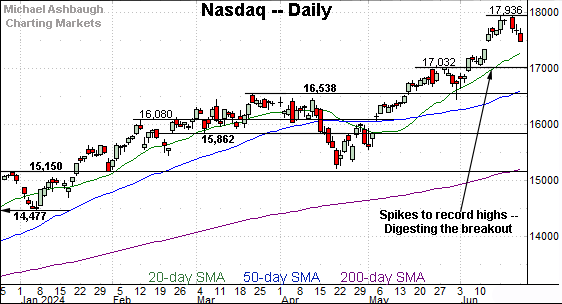
Against this backdrop, the Nasdaq Composite has pulled in from all-time highs.
Tactically, the initial downturn has been underpinned by the top of the mid-June gap (17,490). The late-June low has thus far registered within four points, amid a successful retest.
Widening the view to six months adds perspective.
On this wider view, the Nasdaq is digesting its latest break to record territory.
Tactically, the mid-June gap — illustrated on the hourly chart — is followed by the deeper breakout point (17,030).
On a more detailed note, consider that the early-June spike marked an unusually strong two standard deviation breakout, punctuated by five straight closes atop the 20-day volatility bands (not illustrated). This signals unusually strong bullish momentum that is likely to follow-through higher following a cooling-off period.
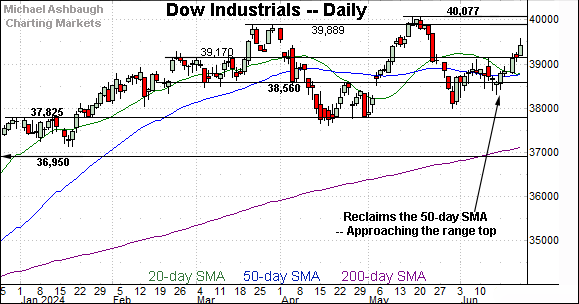
Looking elsewhere, the Dow Jones Industrial Average remains range-bound.
Within the range, the Dow has rallied to one-month highs, placing distance atop its 50-day moving average.
On further strength, the prevailing range top matches record territory. The pending retest from underneath should be a useful bull-bear gauge. As always, the chances of a breakout improve to the extent an index holds relatively tightly to resistance.
Slightly more broadly, the prevailing upturn punctuates a 5.2% pullback from the Dow’s all-time high (40,077). Notably, the 38,000 mark precisely defined the late-May low. (Also see the hourly chart.)
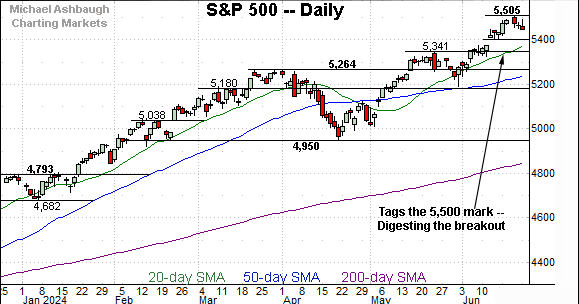
Meanwhile, the S&P 500 has sustained its latest break to all-time highs.
Tactically, the mid-June gap, circa 5,400, is followed by the deeper breakout point (5,341).
And here again, the early-June spike marked a strong two standard deviation breakout, punctuated by three closes atop the 20-day volatility bands (not illustrated) across a four-session span. Bullish price action, for the longer-term.
The bigger picture
As detailed above, the major U.S. benchmarks remain in divergence mode. The prevailing backdrop is not one-size-fits-all.
On a headline basis, the S&P 500 and Nasdaq Composite continue to trend higher, sustaining yet another break to record territory.
Meanwhile, the Dow Jones Industrial Average has not broken out — at least not to record highs — as it lags characteristically behind.
Consider that Nvidia Corp. (NVDA) is not a Dow 30 component, though it has been an influential driver of recent S&P 500 and Nasdaq strength. (Nvidia may be added to the Dow industrials at some point following its recent 10-for-1 stock split. The Dow Jones Industrial Average is a price-weighted index — unlike the other benchmarks — meaning that the actual share price matters. It wouldn’t make sense to add NVDA to the Dow industrials at 1,250 per share, though a 125 share price would fit fine. Apple, Inc. and Amazon.com were added to the Dow 30 following material stock splits.)
Moving to the small-caps, the iShares Russell 2000 ETF (IWM) remains range-bound.
Within the range, the small-cap benchmark has not strayed too far from its 50-day moving average, currently 201.72.
More broadly, the prevailing five-month range bottom closely matches the marquee 200-day moving average. An eventual violation of this area — which currently looks unlikely — would nonetheless raise a technical red flag.
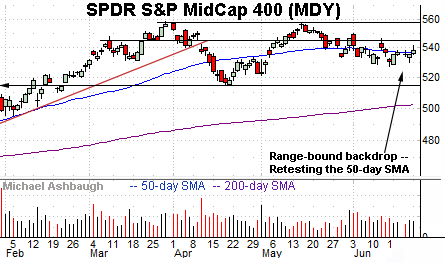
Similarly, the SPDR S&P MidCap 400 ETF (MDY) remains range-bound.
Here again, the mid-cap benchmark has held tightly of late to its 50-day moving average, currently 536.80.
Also consider that the 50-day moving average has flattened in recent weeks, the hallmark of a trendless intermediate-term backdrop. (Also see the Russell 2000’s flatlining 50-day SMA.)
Returning to the S&P 500, its bigger-picture backdrop remains relatively straightforward.
To start, the index has knifed to record highs, rising amid a statistically unusual two standard devation June breakout. (The early-June spike encompassed three closes atop the 20-day volatility bands (not illustrated) across a four-session span.)
More immediately, the selling pressure off the all-time high (5,505) has been distinctly flat. Bullish momentum is intact, based on today’s backdrop.
Tactically, the mid-June gap, circa 5,400, is closely followed by the breakout point (5,341).
Delving deeper, the 50-day moving average, currently 5,244, is rising toward the S&P’s former range top (5,264).
As always, it’s not just what the markets do, it’s how they do it. (For instance, the two standard deviation breakouts stand out.)
But generally speaking, the S&P 500’s bigger-picture bias remains bullish barring a violation of the 5,264 area. Recall this level matches the March peak (5,264.85) and the April peak (5,263.95), as well as the top of the mid-May gap (5,263.26).
Also see June 6: Charting a market whipsaw, Nasdaq knifes to latest record high.
Also see May 16: Charting a May breakout, S&P 500 tags all-time highs.


