Charting a market whipsaw, Nasdaq knifes to latest record high
Focus: Dow industrials and Russell 2000 lag behind amid narrowing market leadership
Technically speaking, the U.S. benchmarks’ bigger-picture backdrop is not one-size-fits-all.
On a headline basis, the S&P 500 and Nasdaq Composite have staged June technical breakouts, rising to tag all-time highs.
Meanwhile, the Dow industrials — and the small- and mid-cap benchmarks — have diverged in recent weeks, pressured as market leadership continues to narrow. The charts below add color:
Editor’s Note: As always, updates can be directly accessed at https://chartingmarkets.substack.com.
Before detailing the U.S. markets’ wider view, the S&P 500’s hourly chart highlights the past four weeks.
As illustrated, the S&P 500 has knifed to yet another record high. The strong June start punctuates a turn-of-the-month volatility spike.
Tactically, the former range top (5,341) pivots to support, and is followed by a firmer floor matching the March peak (5,264). Both areas are also detailed on the daily chart.
Meanwhile, the Dow Jones Industrial Average is lagging firmly behind.
So far behind, in fact, that the index is retesting its 50-day moving average, currently 38,804, from underneath. As always, the 50-day is a widely-tracked intermediate-term trending indicator.
More broadly, the Dow’s recent downturn originates from its record high, slightly atop the 40,000 mark.
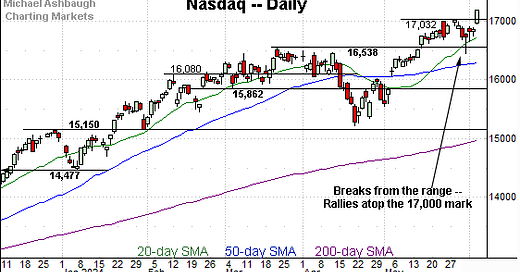
Against this backdrop, the Nasdaq Composite has taken flight.
The strong June start places it firmly atop the 17,000 mark. Tactically, the breakout point (17,032) pivots to first support.
Widening the view to six months adds perspective.
On this wider view, the Nasdaq has broken out, tagging its latest all-time high.
The prevailing upturn punctutates a relatively orderly three-week range.
Slightly more broadly, the strong June start builds on the early-May gap atop the 50-day moving average (in blue).
Tactically, the breakout point (17,032) is followed by major support (16,538) matching the March peak.
Looking elsewhere, the Dow Jones Industrial Average has not broken out.
Instead, the index is digesting a respectable downdraft from its record high, slightly atop the 40,000 mark.
Amid the pullback, the Dow is retesting its 50-day moving average, currently 38,804, from underneath.
Tactically, the 37,610-to-37,825 area broadly marks important support. The Dow’s bigger-picture backdrop remains constructive, in the broad sweep, barring a violation of this area.
Meanwhile, the S&P 500 has cleared its range top, rising to narrowly tag record highs.
The prevailing upturn punctuates a three-week range, of sorts, hinged to the steep early-May rally. Bullish price action.
Tactically, the breakout point (5,341) is followed by major support (5,264), areas detailed in the next section.
The bigger picture
As detailed above, the prevailing bigger-picture technicals are not one-size-fits-all.
On a headline basis, the S&P 500 and Nasdaq Composite have tagged record highs, while the Dow Jones Industrial Average has diverged, pulling in to retest its 50-day moving average.
Amid the cross currents, the bigger-picture backdrop, on balance, remains bullish. Though market leadership continues to narrow — which is not ideal — materially bearish price action largely remains absent.
Moving to the small-caps, the iShares Russell 2000 ETF (IWM) is not breaking out.
Instead, the small-cap benchmark is retesting its 50-day moving average, currently 202.70, an area that has generally underpinned the prevailing five-week range.
More broadly, notice the developing head-and-shoulders bottom defined by the March, April and May lows. This is a high-reliability bullish reversal pattern, and would be punctuated by follow-through above the range top.
Similarly, the SPDR S&P MidCap 400 ETF (MDY) has pulled in from its range top.
Amid the downturn, an extended test of the 50-day moving average, currently 539.25, remains underway.
Combined, the small- and mid-cap benchmarks continue to lag behind the S&P 500, though amid still broadly constructive bigger-picture price action. At least based on today’s backdrop.
Returning to the S&P 500, the index has edged to its latest record high.
The prevailing upturn punctuates a sideways three-week range, as well as a turn-of-the-month market whipsaw.
Tactically, the S&P’s former breakout point (5,264) remains major support, a level matching the March peak (5,264.85) and the April peak (5,263.95), as well as the top of the mid-May gap (5,263.26).
Delving deeper, the 50-day moving average, currently 5,188, is closely followed by the 5,180 support.
The late-May low (5,191) registered nearby, and has been punctuated by a June spike to record territory.
As always, it’s not just what the markets do, it’s how they do it.
But generally speaking, the S&P 500’s bigger-picture bias remains bullish barring a violation of the 5,180 area. This area marks a bull-bear fulcrum, as detailed in the May 16 review.
Also see May 16: Charting a May breakout, S&P 500 tags all-time highs.


