Charting market rotation, S&P 500 revisits 50-day average
Focus: Russell 2000 vies to maintain critical support, 10-year yield revisits key technical levels
U.S. stocks are lower mid-day Friday, pressured as the markets adjust to tighter monetary policy expectations.
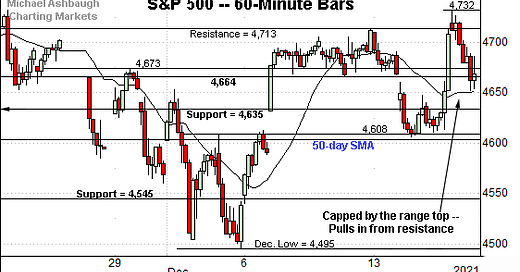
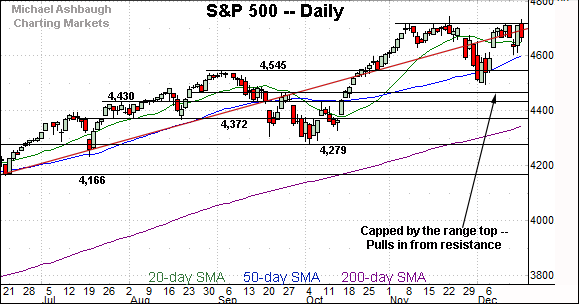
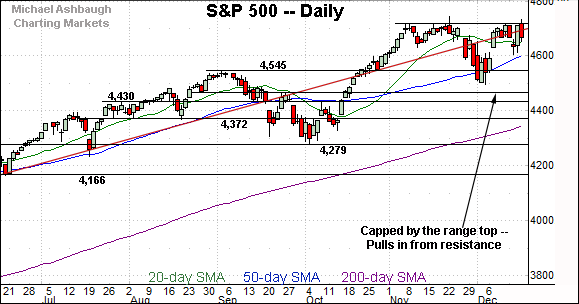
Against this backdrop, the S&P 500 has balked at its range top — the 4,713-to-4,718 area — pulling in as jagged December price action persists.
Editor’s Note: As always, updates can be directly accessed at chartingmarkets.substack.com.
Before detailing the U.S. markets’ wider view, the S&P 500’s hourly chart highlights the past four weeks.
As illustrated, the S&P has registered a relatively modest mid-December whipsaw amid Fed-related volatility.
From current levels, familiar support (4,635) is followed by the deeper 50-day moving average, currently 4,604.
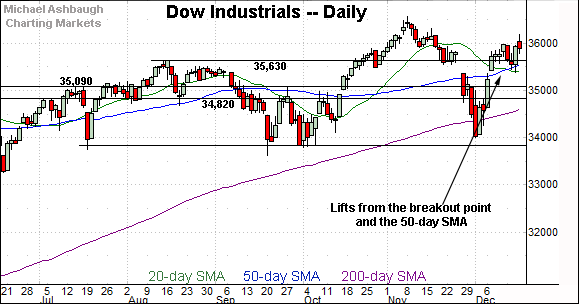
Similarly, the Dow Jones Industrial Average has whipsawed of late near its range top.
Consider that Thursday’s session close (35,897) roughly matched major resistance (35,892).
More immediately, Friday’s early downturn places notable levels in play.
Specific areas include the Dow’s breakout point (35,630) — the 50-day moving average, currently 35,548 — and former gap support (35,366).
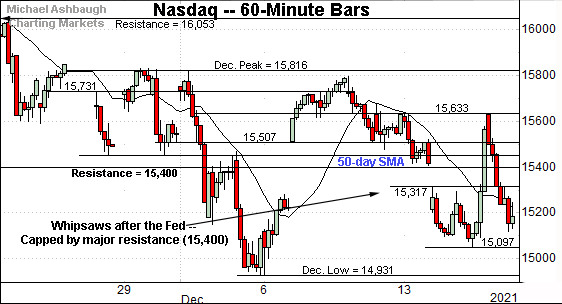
Against this backdrop, the Nasdaq Composite remains the weakest major benchmark.
Tactically, the index has struggled to reclaim major resistance (15,400) — a familiar bull-bear fulcrum — also illustrated below.
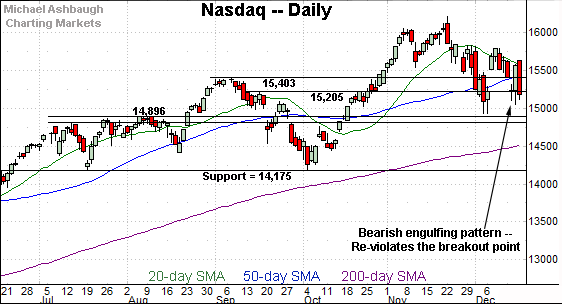
Widening the view to six months adds perspective.
On this wider view, the Nasdaq has whipsawed at its former breakout point (15,403) and the 50-day moving average.
Recall the prevailing downturn punctuates a “lower high” at the December peak raising an intermediate-term question mark.
Tactically, deeper inflection points match the December closing low (15,085) and absolute December low (14,931).
As detailed previously, follow-through under this area would mark a material “lower low” incrementally strengthening the bear case.
(On a granular note, see the bearish engulfing pattern, defined by a session open and close — the long red bar — encompassing the prior session’s corresponding levels.)
Looking elsewhere, the Dow Jones Industrial Average has strengthened this week versus the Nasdaq Composite.
In the process, the index has largely maintained three technical levels: The breakout point (35,630), the 50-day moving average, and gap support (35,366). Constructive price action.
Nonetheless, the latest retest is underway early Friday.
Delving deeper, the Dow’s former range top (35,090) remains an inflection point. A sustained posture atop this area signals a bullish-leaning intermediate-term bias.
Meanwhile, the S&P 500 is also acting relatively well in the broad sweep.
Still, the index has balked at its range top — the 4,713-to-4,718 area — amid persistent selling pressure near resistance.
The bigger picture
As detailed above, the prevailing bigger-picture backdrop is not one-size-fits-all.
On a headline basis, the S&P 500 and Dow Jones Industrial Average remain comparably resilient, maintaining a bullish intermediate-term bias atop major support.
Meanwhile, the Nasdaq Composite has asserted a bearish intermediate-term bias, violating major support (15,400) and its 50-day moving average. Tactically, a sustained reversal atop these areas would strengthen the bull case.
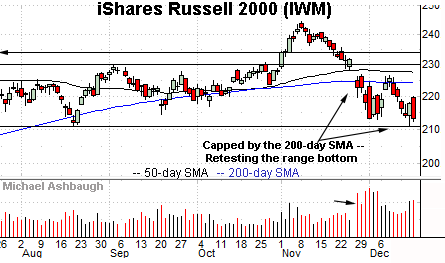
Moving to the small-caps, the iShares Russell 2000 ETF’s backdrop remains bearish.
To start, the early-December rally attempt has been capped by the 200-day moving average, and resistance matching the November gap.
More immediately, a retest of important support — the 209.05-to-210.70 area — remains underway.
Tactically, an eventual violation of this area opens the path to a less-charted patch, and potentially material downside follow-through. (See the five-year chart.)
(Friday’s early session low (210.30) has effectively matched support, and an intraday rally attempt is in play.)
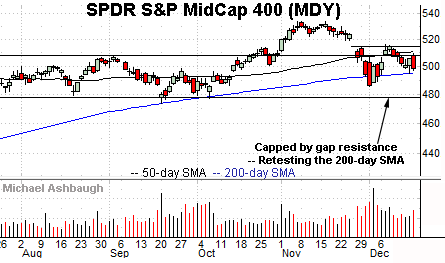
Meanwhile, the SPDR S&P MidCap 400 ETF has also registered less-than-stellar December price action.
To start, the MDY has stalled near gap resistance — (resistance matching the bottom of the November gap) — and pulled in to its former range.
More immediately, an extended test of the 200-day moving average, currently 495.06, remains in play.
Notably, the prevailing retest does not resemble the bullish reversals at the September and October lows. (Both marked single-day retests, punctuated by closes near session highs.)
Returning to the S&P 500, the index continues to act well, though amid defensive sector rotation.
Put differently, safe-haven-fueled sector breakouts — including health care, utilities and consumer staples — have contributed to the S&P 500’s recent relative strength.
This means the December price action is indeed rotational — which is generally bullish — though the current rotation’s structure is unconventional, and less than ideal.
Reservations aside, familiar inflection points stand out.
To start, the S&P’s 50-day moving average, currently 4,604, is followed by the more important breakout point (4,545).
Delving deeper, likely last-ditch support matches the December closing low (4,513) and absolute December low (4,495).
As detailed previously, an eventual violation of the 4,500 area would punctuate a double top — defined by the November and December peaks — raising the flag to a potentially consequential trend shift.
With these areas detailed, and despite recently pronounced market cross currents, the S&P 500’s intermediate-term bias remains bullish based on today’s backdrop.
10-year Treasury note yield reaches major technical test
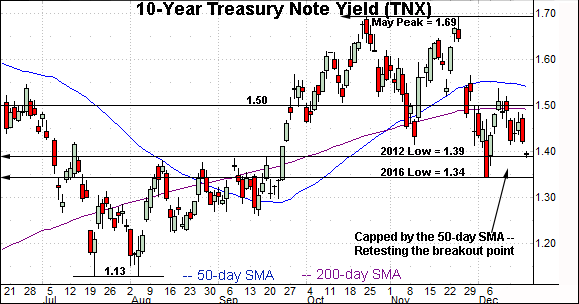
Concluding on a stray note, the 10-year Treasury note yield is back for another crack at potentially consequential territory.
Specifically, recall the 2016 low (1.34) and 2012 low (1.39) define the 2020 breakdown point, the point from which the plunge to pandemic-zone territory originated.
This area also defines the yield’s September breakout point. (See the Sept. 8 review, as the yield’s breakout was taking shape.)
Against this backdrop, the yield’s December downturn remains an unexpected development amid the Federal Reserve’s recent hawkish-leaning policy tilt.
Tactically, the 1.50 area remains an overhead inflection point, and is closely followed by the descending 50-day moving average, currently 1.54.
The yield’s 50-day has marked a useful intermediate-term trending indicator. Upside follow-through opens the path to a higher pleateau, a move consistent with the Fed’s objective of containing inflation.
Conversely, downside follow-through under the 1.34 area opens the path to a lower plateau, and potential test of the summer range bottom (1.13).
Fundamentally, the yield’s downturn may reflect expecations for slowing economic growth — (including potentially recessionary slowing) — and/or could be a function of safe-haven positioning amid heightened global-virus concerns. The year-end price action will likely add color.
(On a granular note, the December low (1.343) has thus far precisely matched the inflection point.)

