Charting a market divergence, Nasdaq violates major support ahead of Fed
Focus: Consumer staples take flight, Oracle sustains earnings-fuleled breakout, XLP, ORCL, MXL, SIMO, DHI
U.S. stocks are lower mid-day Wednesday, pressured ahead of the Federal Reserve’s potentially consequential policy statement, due out this afternoon.
Against this backdrop, the Nasdaq Composite has placed distance under major support — the 15,400 area — even as the S&P 500’s prevailing downturn has inflicted comparably limited damage.
Editor’s Note: As always, updates can be directly accessed at chartingmarkets.substack.com.
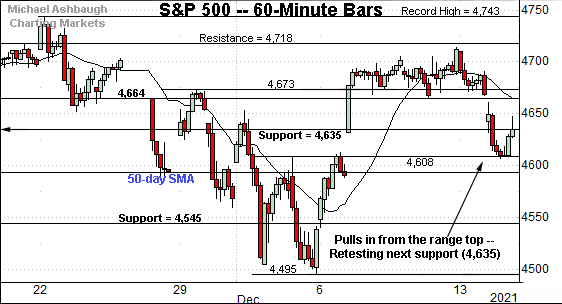
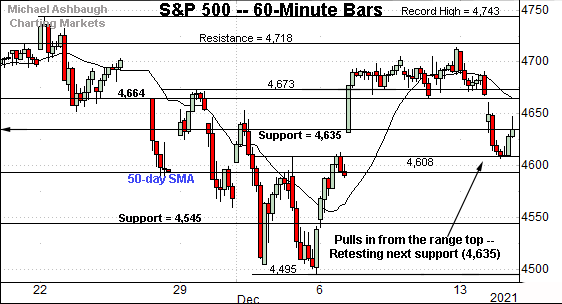
Before detailing the U.S. markets’ wider view, the S&P 500’s hourly chart highlights the past four weeks.
As illustrated, the S&P has pulled in from its range top.
The downturn places familiar support (4,635) back in play.
Tuesday’s session close (4,634.1) registered nearby.
Slightly more broadly, the prevailing downturn has filled the early-December gap.
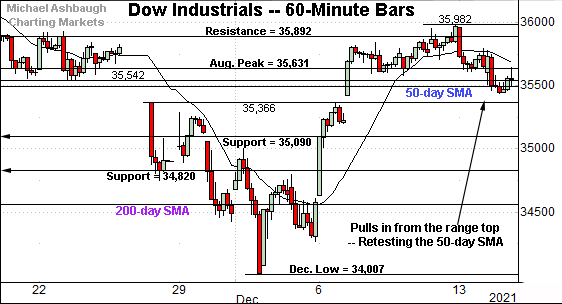
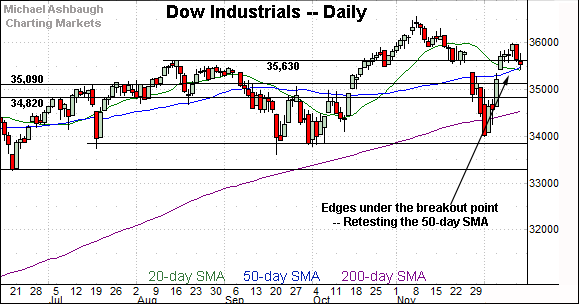
Meanwhile, the Dow Jones Industrial Average has held more tightly to its range top.
Still, an extended retest of the 50-day moving average, currently 35,493, remains in play.
(On a granular note, Tuesday’s close (35,544) effectively matched near-term support (35,542), an area detailed repeatedly.)
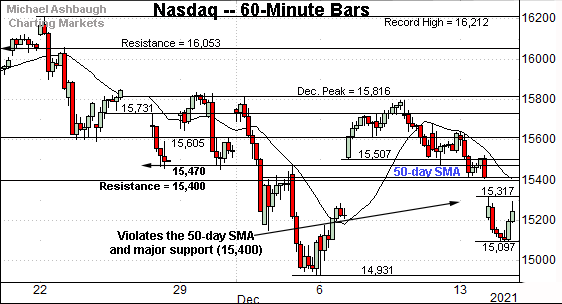
Against this backdrop, the Nasdaq Composite has pulled in more aggressively.
The prevailing downturn places the index under its 50-day moving average — as well as major support (15,400) — areas also illustrated below.
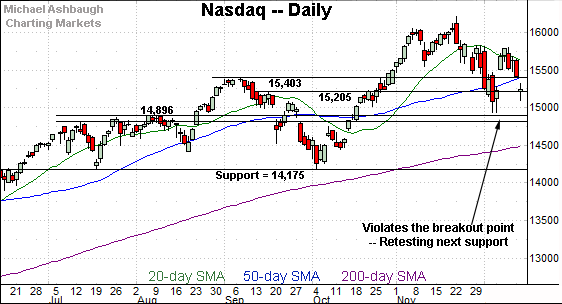
Widening the view to six months adds perspective.
On this wider view, the Nasdaq has reversed back under its 50-day moving average, currently 15,414, and the former breakout point (15,403).
The prevailing downturn punctuates a “lower high” at the December peak raising an intermediate-term question mark.
Tactically, next support (15,205) is followed by the December closing low (15,085) and absolute December low (14,931).
Follow-through under this area would mark a material “lower low” incrementally strengthening the bear case.
Looking elsewhere, the Dow Jones Industrial Average has ventured back under its breakout point (35,630) a familiar headline technical level.
Delving deeper, the ascending 50-day moving average, currently 35,492, is followed by the former range top (35,090).
Tactically, the Dow’s bullish intermediate-term bias gets the benefit of the doubt barring a violation of these areas.
More broadly, the December range spans just under 2,000 points, roughly from the 34,000 mark to the 36,000 mark. (Also see the hourly chart.)
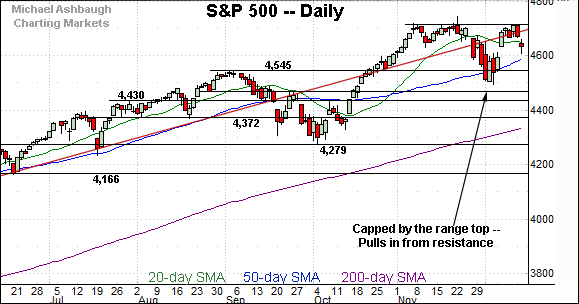
True to recent form, the S&P 500 remains the strongest major benchmark.
Still, the index has stalled at its range top, and pulled in from resistance.
Tactically, the 50-day moving average, currently 4,592, is followed by the more important breakout point (4,545).
The bigger picture
As detailed above, the major U.S. benchmarks remain in divergence mode. Each index is doing slightly different things.
On a headline basis, the S&P 500 has pulled in from its latest record close, pressured amid a downturn that has thus far inflicted limited damage.
Meanwhile, the Dow Jones Industrial Average has ventured under major support (35,630), pressured amid an extended test of the 50-day moving average.
And scaling down in strength incrementally, the Nasdaq Composite has more decisively violated major support (15,400) an area closely matching its 50-day moving average.
Combined, the prevailing backdrop is not one-size-fits-all.
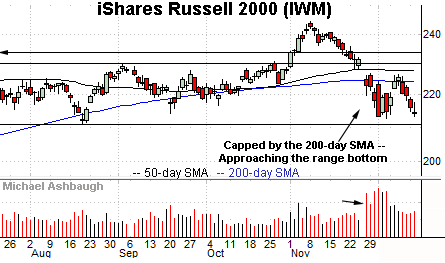
Moving to the small-caps, the iShares Russell 2000 ETF remains the weakest widely-tracked U.S. benchmark.
As illustrated, the early-December strong-volume downdraft has been punctuated by a failed test of the 200-day moving average from underneath. Bearish price action.
More immediately, the December low (212.71) is closely followed by the prevailing range bottom — the 209.05-to-210.70 area.
Tactically, an eventual violation would mark a material “lower low” opening the path to potentially material downside follow-through. (The five-year chart illustrates this potentially consequential technical area. See link for chart.)
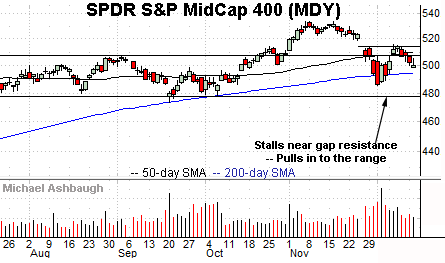
Meanwhile, the SPDR S&P MidCap 400 ETF remains comparably stronger than the Russell 2000.
Still, the MDY has stalled near gap resistance — (resistance matching the bottom of the November gap) — and pulled in to its former range.
Against this backrop, the marquee 200-day moving average, currently 494.56, is increasingly within view.
Though the 200-day underpinned the September and October lows, the December retest has been less inspiring.
Placing a finer point on the S&P 500, this remains the strongest widely-tracked U.S. benchmark.
Nonetheless, the index has pulled in from its range top. The prevailing downturn has filled the early-December gap.
More broadly, familiar technical levels remain in play.
To start, gap support (4,632) is followed by the ascending 50-day moving average, currently 4,592.
Delving deeper, the S&P’s breakout point (4,545) remains a headline bull-bear fulcrum.
On further weakness, likely last-ditch support matches the December closing low (4,513) and absolute December low (4,495).
An eventual violation of this area would punctuate a double top — defined by the November and December peaks — raising the flag to a potentially consequential trend shift.
Based on today’s backdrop, the S&P 500’s intermediate-term bias remains bullish.
Watch List
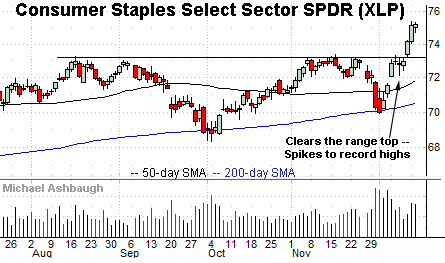
Drilling down futher, the Consumer Staples Select Sector SPDR is acting well technically. (Yield = 2.5%.)
As illustrated, the shares have knifed to record territory, clearing a four-month range top. The prevailing upturn originates from the 200-day moving average.
Though near-term extended, and due to consolidate, the strong-volume spike is longer-term bullish. Tactically, the breakout point (73.25) pivots to well-defined support.
On a granular note, sector components Coca-Cola Co. (KO) and PepsiCo (PEP) combine for a nearly 20% ETF weighting, and recent breakouts have contributed to the group’s December surge.
Moving to specific names, Oracle Corp. is a well positioned large-cap software vendor.
Technically, the shares have recently gapped to all-time highs, rising sharply after the company’s quarterly results signaled strong growth in its transition to cloud-based software services.
The subsequent pullback places the shares near the breakout point (98.95) and 6.5% under the December peak.
Delving deeper, the 50-day moving average, currently 94.66, marked a November and June inflection point.
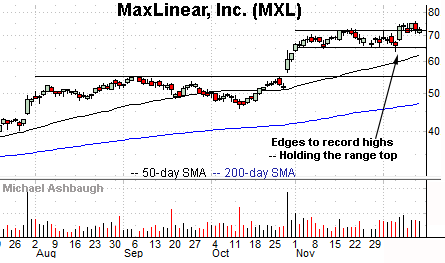
MaxLinear, Inc. is a well positioned large-cap semiconductor name.
The shares initially spiked six weeks ago, knifing to record highs after the company’s strong third-quarter results.
More immediately, the shares have asserted a bull flag — the tight one-week range — hinged to the relatively narrow November trading range. (The prevailing flag pattern originates from last week’s strong-volume breakout attempt.)
Tactically, near-term support (70.60) is followed by the former range bottom, circa 66.00. A sustained posture higher signals a firmly-bullish bias.
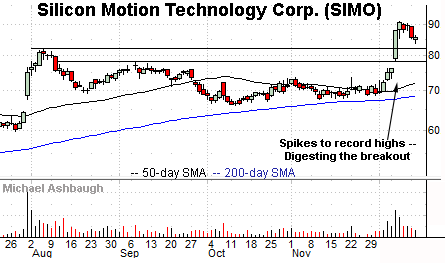
Silicon Motion Technology Corp. is a mid-cap Hong Kong-based semiconductor name.
Earlier this month, the shares knifed to record territory, rising after the company announced a $200 million share buyback program and reiterated its forward outlook.
The subsequent pullback has been comparably flat, fueled by decreased volume, placing the shares 6.5% under the December peak.
Tactically, the post-breakout low (83.55) is followed by the breakout point (81.90).
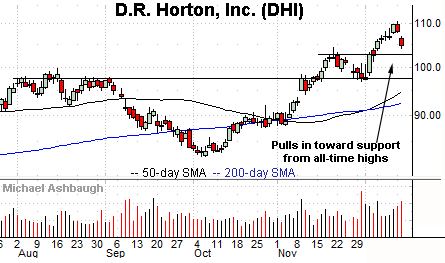
Finally, D.R. Horton, Inc. is a well positioned large-cap homebuilder.
The shares started December with a breakout, knifing to record highs from a tight late-November range.
More immediately, the prevailing pullback places the shares 5.5% under the November peak. Tactically, a sustained posture atop the breakout point (102.50) signals a comfortably bullish bias.


