S&P 500 nudges record high amid market rotation
Focus: Health care sector's breakout attempt, Homebuilders assert bearish posture, Alphabet's breakout attempt, XLV, XHB, CSCO, GOOGL, DOCU, DKNG
U.S. stocks are mixed early Friday, treading water ahead of the Federal Reserve’s policy directive, due out next week.
Against this backdrop, the S&P 500 is pressing record highs amid a pulling-teeth breakout attempt punctuated by a modest re-rotation toward growth.
Editor’s Note: As always, updates can be directly accessed at chartingmarkets.substack.com.
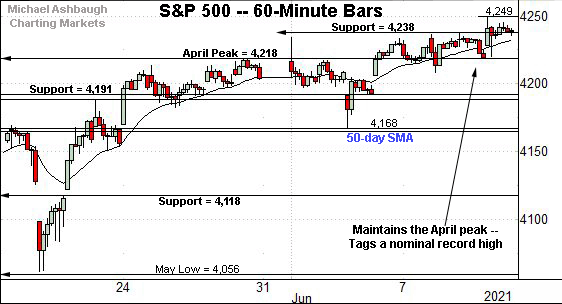
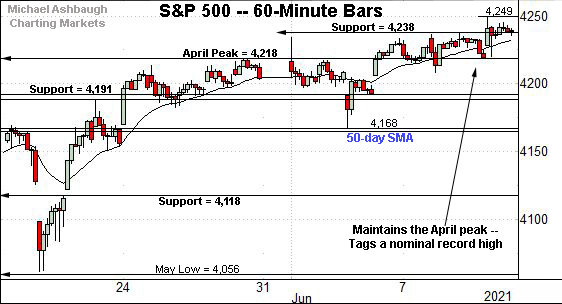
Before detailing the U.S. markets’ wider view, the S&P 500’s hourly chart highlights the past four weeks.
As illustrated, the S&P has edged to record territory. Thursday’s close (4,239.18) and session high (4,249.74) marked nominal new records.
In practice, the breakout attempt remains underway.
The prevailing upturn punctuates a successful test of the April peak (4,218), detailed repeatedly.
Wednesday’s session low (4,218.7) and Thursday’s session low (4,220.3) registered nearby.
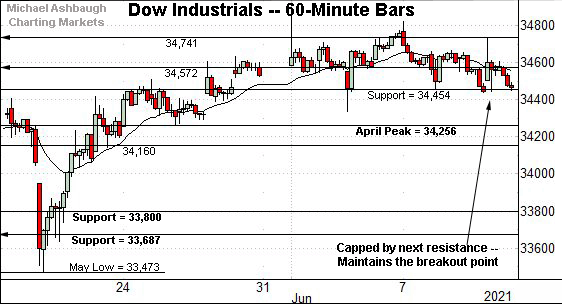
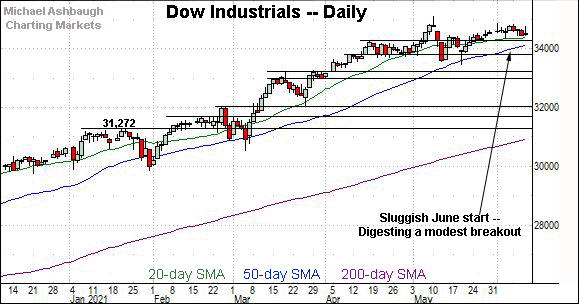
Meanwhile, the Dow Jones Industrial Average is digesting its late-May breakout.
Tactically, Thursday’s session high (34,738) registered within three points of gap resistance (34,741), detailed previously.
Conversely, the session low (34,447) roughly matched the Dow’s breakout point (34,454), an area detailed repeatedly. (Recall Tuesday’s session low (34,453) also matched the breakout point (34,454).
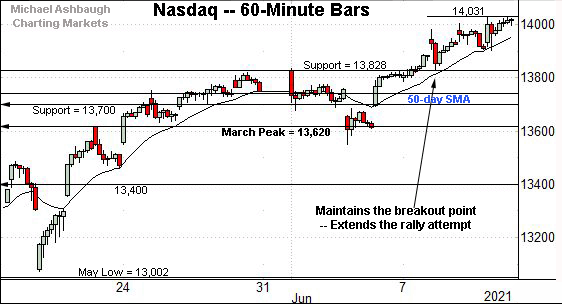
Against this backdrop, the Nasdaq Composite has extended its June breakout.
The prevailing grinding-higher follow-through punctuates a successful test of the breakout point (13,828).
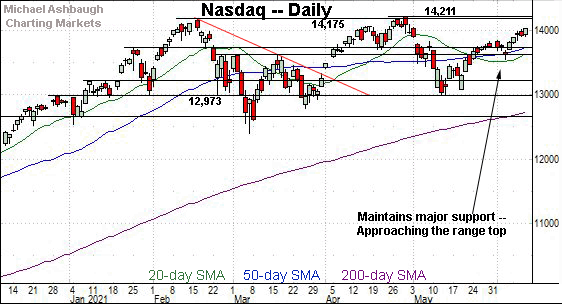
Widening the view to six months adds perspective.
On this wider view, the Nasdaq has extended its rally attempt, rising amid a recent re-rotation toward growth.
This week’s follow-through punctuates a jagged test of major support matching the March peak (13,620). The June closing low (13,614) registered nearby.
Tactically, overhead inflection points match the Nasdaq’s record close (14,138.77), the Feb. peak (14,175) and the absolute record peak (14,211.57).
Looking elsewhere, the Dow industrials have pulled in modestly as the Nasdaq extends slightly higher.
Nonetheless, the index has sustained its late-May breakout.
Tactically, the breakout point (34,454) is followed by the April peak (34,256), areas also detailed on the hourly chart.
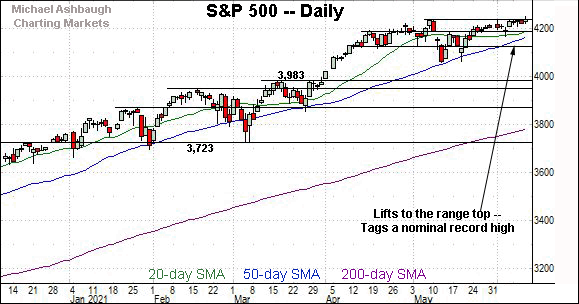
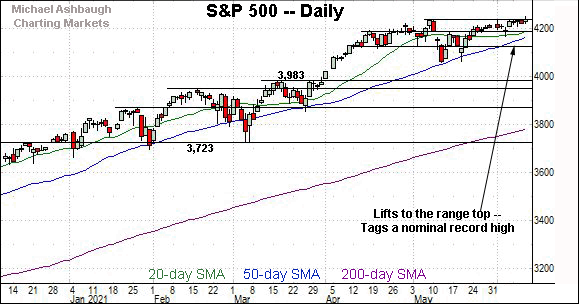
Meanwhile, the S&P 500 narrowly tagged record highs.
The prevailing upturn punctuates a successful test of the April peak (4,218), an area detailed on the hourly chart.
The bigger picture
As detailed above, the U.S. benchmarks are acting well technically even amid still generally sluggish June price action.
On a headline basis, the S&P 500 has tagged a nominal record high, the Nasdaq Composite has extended its June breakout, and the Dow industrials have pulled in modestly amid rotational price action.
(Tactically, the S&P 500 and Dow industrials have more or less nailed near-term support, detailed on the hourly charts.)
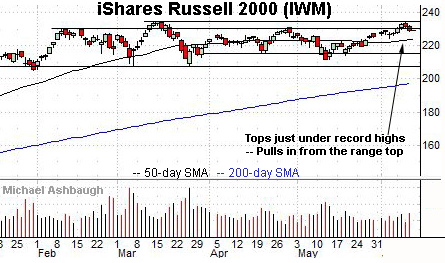
Moving to the small-caps, the iShares Russell 2000 ETF has hesitated near its range top.
The small-cap benchmark’s record close (234.42) and absolute record peak (234.53) remain within view.
Recall the prevailing upturn punctuates a prolonged four-month range, laying the groundwork for potentially decisive follow-though. Initial selling pressure near the range top has been flat. Constructive price action.
(Editor’s Note: The MDY’s backdrop has been omitted due to space limitations.)
Placing a finer point on the S&P 500, the index has tagged nominal record highs.
The prevailing breakout attempt punctuates a tight three- to four-session range.
Recall that consecutive session lows closely matched the April peak (4,218). Constructive price action.
More broadly, the S&P 500’s pulling-teeth breakout attempt remains underway.
Tactically, the S&P’s breakout point (4,191) is followed by the June low (4,168) and the ascending 50-day moving average, currently 4,166. A sustained posture atop this area signals a comfortably bullish intermediate-term bias.
Conversely, a near- to intermediate-term target projects from the S&P’s May range to the 4,310 area, detailed repeatedly.
Watch List
Drilling down further, consider the following sectors and individual names:
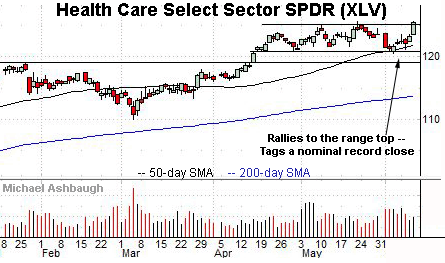
To start, the Health Care Select Sector SPDR is acting well technically. (Yield = 1.4%.)
As illustrated, the group has tagged a nominal record close, rising from a nearly two-month range. An intermediate-term target projects to the 130 area.
Conversely, the former range top (125.25) is followed by the 50-day moving average, currently 121.90. The group’s breakout attempt is intact barring a violation.
Meanwhile, the SPDR S&P Homebuilders ETF has asserted a bearish posture.
Technically, the group is pressing a two-month range bottom, pressured from a failed test of the 20-day moving average.
Perhaps paradoxically, the group’s downturn has registered amid recently easing interest rates. Recall the 10-year Treasury yield has tagged three-month lows, as detailed Wednesday.
Market bears might point to a market pricing for slowing economic growth, and tamer inflation expectations.
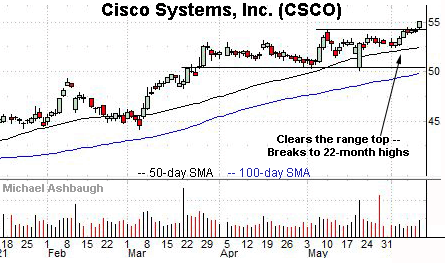
Cisco Systems, Inc. is a well positioned Dow 30 component. (Yield = 2.7%.)
As illustrated, the shares have tagged 22-month highs, clearing resistance matching the May peak. The prevailing upturn punctuates a tight three-session range.
Tactically, an intermediate-term target projects to the 58 area. Conversely, the breakout point, circa 54.00, pivots to support.
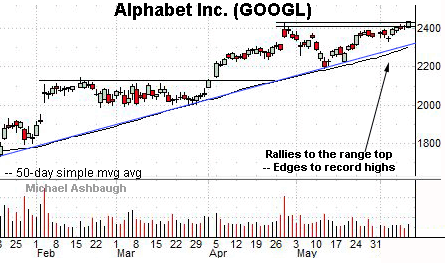
Alphabet, Inc is a well positioned large-cap name, rising amid this week’s re-rotation toward growth.
Technically, the shares have tagged nominal record highs amid a slow-motion June breakout attempt.
The prevailing upturn originates from trendline support closely tracking the 50-day moving average. A sustained posture atop the trendline signals a comfortably bullish bias.
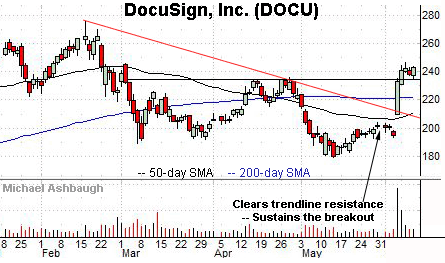
DocuSign, Inc. is a large-cap provider of e-signature solutions, rising amid this week’s re-rotation toward growth.
Technically, the June trendline breakout punctuates a double bottom defined by the March and May lows.
The prevailing flag pattern — the tight three-session range, underpinned by the breakout point (234.50) — positions the shares to build on the initial strong-volume spike.
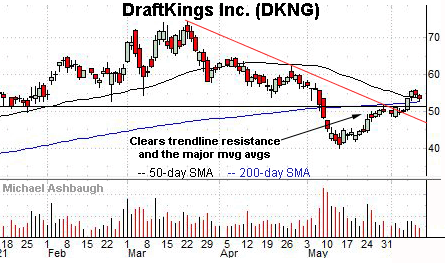
Finally, DraftKings, Inc. is a large-cap name coming to life technically.
As illustrated, the shares have staged a June trendline breakout, also clearing the 50- and 200-day moving averages.
Underlying the upturn, its relative strength index (not illustrated) has registered nearly three-month highs, improving the chances of incremental follow-through.
Tactically, the former breakdown point, circa 51.00, pivots to support. The prevailing rally attempt is intact barring a violation.


