Charting a bull-flag breakout attempt, S&P 500 presses record high
Focus: 10-year yield presses three-month lows, Emerging markets sustain breakout, TNX, EEM, MRVL, NUE, CRM, YETI
U.S. stocks are mixed mid-day Wednesday, vacillating amid sluggish, but still rotational, June price action.
Against this backdrop, the S&P 500 is challenging territory amid a bull-flag breakout attempt that remains underway.
Editor’s Note: As always, updates can be directly accessed at chartingmarkets.substack.com.
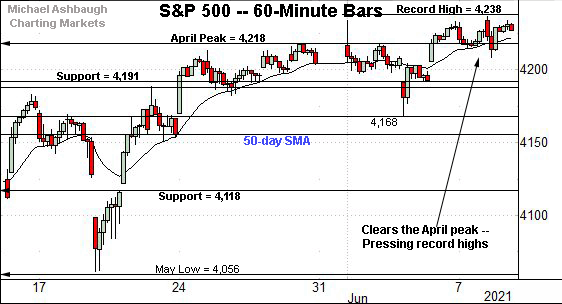
Before detailing the U.S. markets’ wider view, the S&P 500’s hourly chart highlights the past four weeks.
As illustrated, the S&P has sustained a modest break atop the April peak (4,218).
The prevailing upturn places its record close (4,232.60) and absolute record peak (4,238.04) just overhead. Consecutive session highs have registered within about one point.
Meanwhile, the Dow Jones Industrial Average has sustained its late-May breakout.
Consider that Tuesday’s session low (34,453) matched the breakout point (34,454) — detailed Monday — to punctuate a second recent retest. Bullish price action.
Against this backdrop, the Nasdaq Composite has belatedly broken out.
Here again, Tuesday’s session low (13,832) roughly matched the breakout point (13,828), detailed previously. Constructive price action.
Widening the view to six months adds perspective.
On this wider view, the Nasdaq has extended its rally attempt.
This week’s follow-through punctuates a jagged test of major support matching the March peak (13,620). The June closing low (13,614) registered nearby.
More broadly, the Nasdaq’s break to five-week highs — following the successful test of major support (13,620) — incrementally strengthens its already bullish-leaning intermediate-term bias.
Tactically, overhead inflection points match the 14,000 mark and the Feb. peak (14,175).
Looking elsewhere, the Dow industrials’ backdrop remains comparably straightforward.
As illustrated, the index has sustained its late-May breakout amid a flattish June start.
Its record close record close (34,777.76) and absolute record peak (35,091.56) remain within striking distance.
Meanwhile, the S&P 500 has slightly extended its late-May breakout.
Recall the prevailing upturn punctuates a successful test of the breakout point (4,191), an area also detailed on the hourly chart.
The bigger picture
Collectively, the U.S. benchmarks’ bigger-picture backdrop remains bullish, and has strengthened on the margin amid this week’s follow-through.
On a headline basis, the Nasdaq Composite has belatedly broken out — clearing a five-week range top — while the S&P 500 and Dow industrials remain within striking distance of record highs.
(Also recall the Dow industrials and Nasdaq Composite effectively nailed their respective breakout points in Tuesday’s action.)
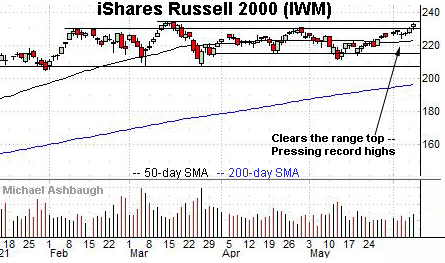
Moving to the small-caps, the iShares Russell 2000 ETF has also come to life, clearing its range top.
Tactically, the upturn places its record close (234.42) and absolute record peak (234.53) just overhead.
Conversely, the breakout point — the 230.30-to-230.95 area — pivots to support.
More broadly, the prevailing upturn punctuates a prolonged four-month range — and has been fueled by a volume uptick — laying the groundwork for potentially decisive follow-though. The pending retest of record highs from underneath should add color.
(Editor’s Note: The MDY’s backdrop has been intentionally omitted due to space limitations.)
Placing a finer point on the S&P 500, the index is acting well enough amid grinding-higher price action.
The prevailing flag-like pattern — the tight three-session range — signals muted selling pressure near record highs, improving the chances of eventual follow-through.
Returning to the six-month view, the S&P 500’s slow-motion breakout attempt remains in play.
Tactically, the S&P’s record close (4,232.60) and absolute record peak (4,238.04) remain just overhead.
Tuesday’s session high (4,236.74) and Wednesday’s early session high (4,237.09) have narrowly missed a new record.
On further strength, a near- to intermediate-term target projects from the S&P’s mini double bottom to the 4,310 area, detailed repeatedly.
Conversely, the S&P’s breakout point (4,191) is followed by the June low (4,168) and the ascending 50-day moving average, currently 4,155. A sustained posture atop this area signals a comfortably bullish intermediate-term bias.
Editor’s Note: The next review will be published Friday.
Watch List
Drilling down further, consider the following sectors and individual names:
To start, the 10-year Treasury note yield is challenging three-month lows.
The June downturn punctuates a failed test of the 50-day moving average from underneath.
More immediately, the yield has ventured under its 100-day moving average, currently 1.49, early Wednesday. The yield has not closed under the 100-day moving average since late September.
Tactically, downside follow-through opens the path to a less-charted patch. Recall the 2016 low (1.34) marks a significant longer-term inflection point. (The 2016 low (1.34) capped the “pandemic-zone,” territory that may never be revisited.)
Conversely, the yield’s breakdown point (1.53) is followed by the 50-day moving average, currently 1.61. A reversal higher would preserve the prevailing range.
Looking elsewhere, the iShares MSCI Emerging Markets ETF is acting well technically. (Yield = 1.4%.)
Earlier this month, the shares gapped to three-month highs, punctuating a relatively tight range. See the double bottom, defined by the March and May lows.
More immediately, the prevailing pullback places the shares at an attractive entry near the breakout point (55.25).
Tactically, trendline support roughly matches the 50-day moving average, currently 54.10. The prevailing rally attempt is intact barring a violation.
Moving to specific names, Marvell Technology, Inc. is a large-cap semiconductor name coming to life.
Technically, the shares have knifed atop trendline resistance, rising after the company’s strong first-quarter results. Eventual follow-through atop the April peak (51.50) would mark a “higher high” confirming the trend shift.
Conversely, gap support (48.90) closely matches the trendline. The recovery attempt is intact barring a violation.
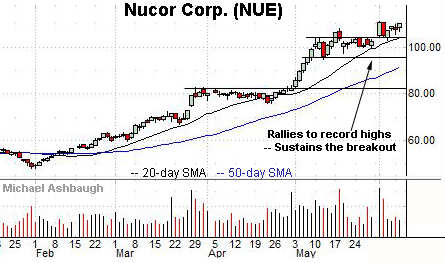
Nucor Corp. is a well positioned large-cap steel producer.
The shares started June with a breakout, gapping to record highs amid a volume spike. The subsequent flag pattern has formed amid decreased volume, positioning the shares to extend the uptrend.
Tactically, the 20-day moving average, currently 104.00, is followed by the June low (102.75). A sustained posture higher signals a bullish bias.
Salesforce.com, Inc. is a well positioned large-cap software vendor.
Late-last month, the shares gapped atop trendline resistance, rising after the company’s quarterly results.
The subsequent pullback has been underpinned by trendline support amid a jagged test of the range top.
Tactically, gap support (229.52) closely matches the June low (229.43). The prevailing rally attempt is intact baring a violation.
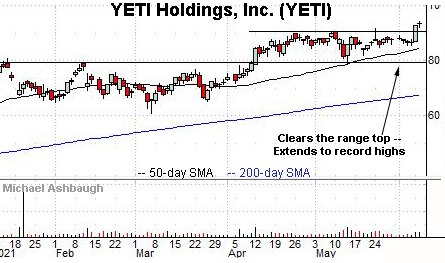
Finally, Yeti Holdings, Inc. is a large-cap retailer of outdoor and recreation products, including coolers and camping equipment.
Technically, the shares have knifed to record highs, rising from a two-month continuation pattern. An intermediate-term target projects to the 100 area.
Conversely, the breakout point, circa 90.50, pivots to well-defined support.
Editor’s Note: The next review will be published Friday.


