Charting a modest June breakout, S&P 500 approaches record territory
Focus: Semiconductor sector's stealth breakout attempt, SMH, GM, SKX, ATVI, PXD
U.S. stocks are mixed early Monday, vacillating amid familiar inflation concerns.
Against this backdrop, the S&P 500 and Dow industrials are effectively treading water in the wake of modest technical breakouts to conclude last week.
Editor’s Note: As always, updates can be directly accessed at chartingmarkets.substack.com.
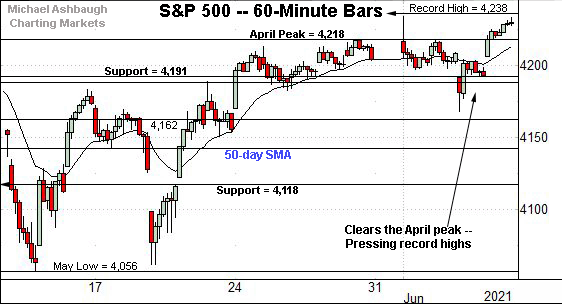
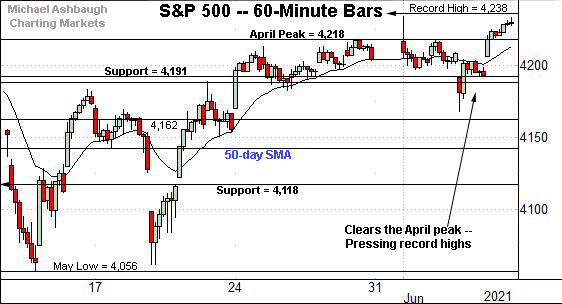
Before detailing the U.S. markets’ wider view, the S&P 500’s hourly chart highlights the past four weeks.
As illustrated, the S&P has finally cleared the April peak, rising within view of record highs.
Last week’s close (4,229.89) missed a record close (4,232.60) by less than three points.
The prevailing upturn originates from the breakout point (4,191). Recall Thursday’s close (4,192) registered nearby.
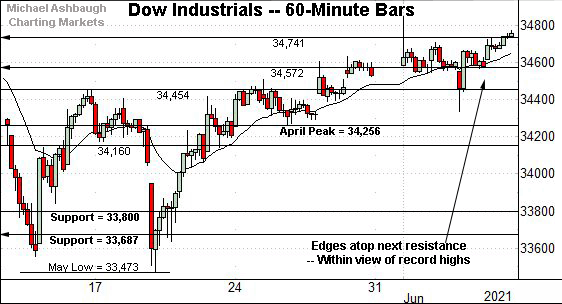
Similarly, the Dow Jones Industrial Average has extended its uptrend.
Here again, last week’s close (34,756.39) narrowly missed a record close (34,777.76), by about 21 points.
Recall the prevailing upturn originates from the Dow’s breakout point (34,454).
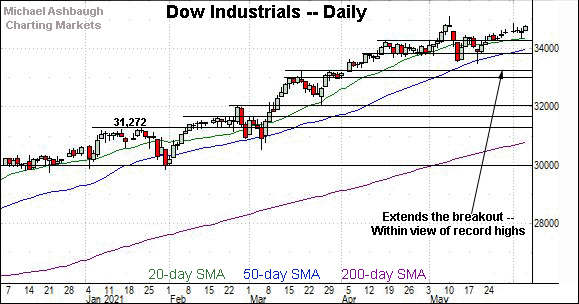
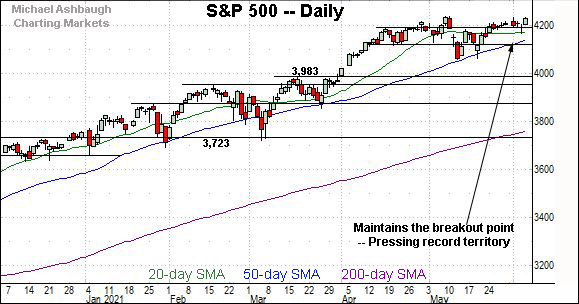
More broadly, the index is traversing less-charted territory — illustrated on the daily chart — amid grinding-higher price action.
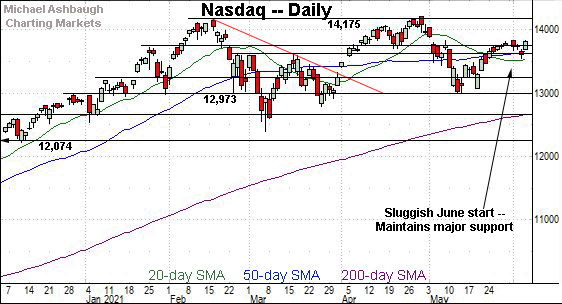
Against this backdrop, the Nasdaq Composite has not yet extended its uptrend.
Nonetheless, the index has weathered a shaky retest of major support matching the March peak (13,620).
The prevailing upturn punctuates a small single-session island reversal.
(The island reversal is generally a high-reliability reversal pattern, though its reliability strengthens with its duration and the size of the gaps, both of which are small in the present case.)
Tactically, overhead inflection points match the former range top (13,828) and the June peak (13,836).
Widening the view to six months adds perspective.
On this wider view, the Nasdaq has registered a sluggish June start
Tactically, the 50-day moving average, currently 13,671, and the March peak (13,620) remain bull-bear inflection points.
More broadly, the Nasdaq’s intermediate-term bias remains bullish-leaning. An eventual violation of the March peak (13,620) would raise a question mark.
Looking elsewhere, the Dow industrials’ backdrop remains more firmly bullish.
Tactically, the breakout point (34,454) and April peak (34,256) remain downside inflection points. (See the hourly chart.)
Conversely, the Dow’s record close (34,777.76) and absolute record peak (35,091.56) are increasingly within striking distance.
Similarly, the S&P 500 has slightly extended its late-May breakout.
Here again, the prevailing upturn originates from the breakout point (4,191), an area also detailed on the hourly chart.
The bigger picture
As detailed above, the U.S. benchmarks are acting well technically amid largely grinding-higher June price action.
On a headline basis, the S&P 500 and Dow industrials narrowly missed record closes to conclude last week — by about two and 21 points respectively.
Both benchmarks are rising from a successful test of their respective breakout points.
Meanwhile, the Nasdaq Composite has registered a bullish reversal near major support (13,620). Constructive price action.
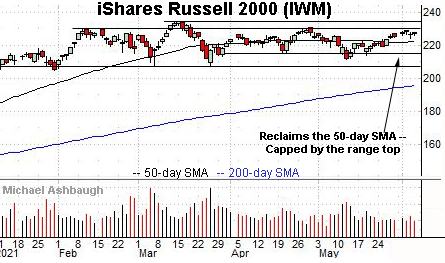
Moving to the small-caps, the iShares Russell 2000 ETF remains range-bound.
To reiterate, notable overhead spans from 230.30 to 230.95, levels matching the February and April peaks.
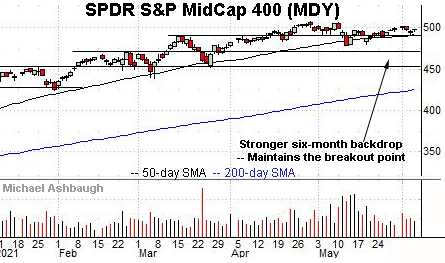
Perhaps not surprisingly, the SPDR S&P MidCap 400 remains slightly stronger.
Tactically, familiar inflection points match the 50-day moving average, currently 492.02, and the former breakout point (489.50).
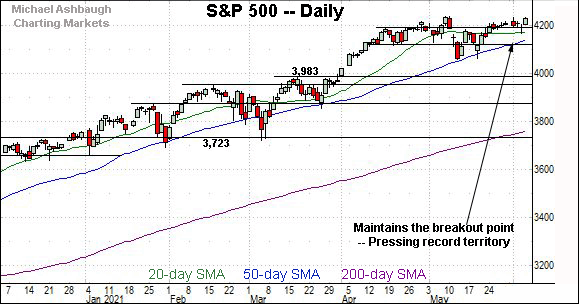
Placing a finer point on the S&P 500, the index has extended its uptrend.
The prevailing upturn punctuates an unusually tight three-week range — a coiled spring — laying the groundwork for potentially more decisive follow-through.
Tactically, the April peak (4,218) pivots to support.
Monday’s early session low (4,217.4) has registered nearby.
Returning to the six-month view, the S&P 500 has inched within view of record territory.
Its record close (4,232.60) and absolute record peak (4,238.04) rest just overhead.
On further strength, a near- to intermediate-term target projects from the S&P’s mini double bottom to about 4,310, detailed repeatedly. This level matches a former target — the 4,308-to-4,318 area, detailed May 10 — though based on a different projection.
More broadly, the S&P 500’s intermediate-term bias remains comfortably bullish. The pending retest of record highs from underneath will likely add color.
Editor’s Note: The next review will be published Wednesday.
Watch List
Drilling down further, consider the following sectors and individual names:
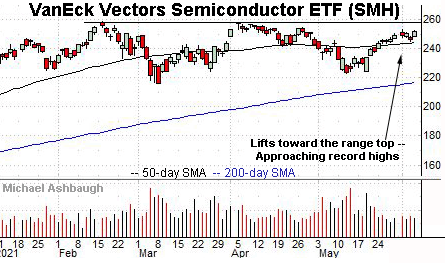
To start, the VanEck Vectors Semiconductor ETF is setting up well technically.
As illustrated, the group has rallied toward the range top, rising within view of record territory.
The prevailing upturn punctuates a developing double bottom — the W formation — defined by the March and May lows.
Tactically, the June low (244.80) and the 50-day moving average, currently 244.50, offer areas to work against. A breakout attempt is in play barring a violation.
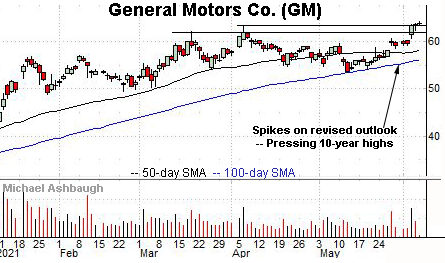
Moving to specific names, General Motors Co. is a well positioned large-cap name.
As illustrated, the shares have knifed to the range top, rising to tag 10-year highs after the company’s upwardly revised guidance.
The upturn has been fueled by a volume spike — and punctuated by muted selling pressure near resistance — laying the groundwork for potentially more decisive follow-through. An intermediate-term target projects to the 70 area.
Tactically, the former range top (61.90) is followed by near-term support, circa 60.25. A breakout attempt is in play barring a violation.
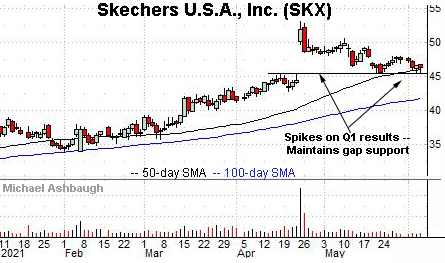
Skechers U.S.A., Inc. is a well positioned large-cap footwear name.
The shares initially spiked six weeks ago, gapping to five-year highs after the company’s quarterly results. The subsequent pullback places the shares 14.6% under the April peak.
Tactically, the 50-day moving average, currently 46.20, is closely followed by gap support (45.38). A sustained posture higher signals a bullish bias.
(Note the prevailing pullback has nearly filled the gap, narrowly missing by just 11 cents.)
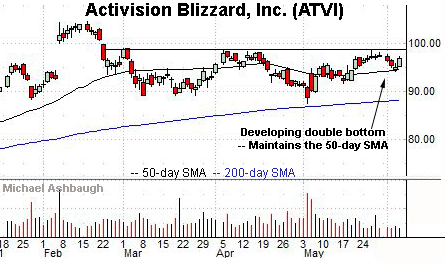
Activision Blizzard, Inc. is a well positioned large-cap video game developer.
Technically, the shares are rising from a developing double bottom defined by the March and May lows.
Against this backdrop, the 50-day moving average has marked an inflection point. A breakout attempt is in play barring a violation.
More broadly, the shares are well positioned on the five-year chart, rising from a bullish continuation pattern hinged to the sharp early-2021 breakout.
Finally, Pioneer Natural Resources Co. is a well positioned large-cap oil and gas name.
As illustrated, the shares have rallied to the range top, rising to challenge two-year highs. The strong June start punctuates a double bottom defined by the April and May lows.
Tactically, an intermediate-term target projects to the 192 area on follow-through. Conversely, a breakout attempt is in play barring a violation of near-term support (162.10).
Editor’s Note: The next review will be published Wednesday.


