Charting a primary trend shift, Nasdaq knifes atop 200-day average
Focus: Apple's trendline breakout, Select rate-sensitive sectors take flight, AAPL, IYR, XHB, KIE
Technically speaking, the major U.S. benchmarks have taken flight — in key spots — rising amid potentially consequential price action.
In the process, the S&P 500 has extended a powerful trendline breakout, while the Nasdaq Composite has knifed aggressively atop its 200-day moving average. Both events confirm a longer-term trend shift, initially signaled last week.
Editor’s Note: As always, updates can be directly accessed at https://chartingmarkets.substack.com.
Before detailing the U.S. markets’ wider view, the S&P 500’s hourly chart highlights the past four weeks.
As illustrated, the S&P is digesting a break to five-month highs.
Tactically, the Jan. peak (4,094) marks a near-term floor.
Monday’s session low (4,093) effectively matched support amid a successful retest. Tuesday’s early session low (4,095) has also registered nearby.
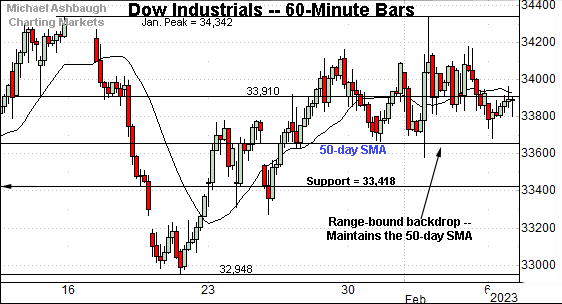
True to recent form, the Dow Jones Industrial Average remains range-bound.
Tactically, the Jan. peak (34,342) marks the range top.
Last week’s high (34,334) — also the Feb. peak — registered within eight points.
Within the range, the index has maintained its 50-day moving average, currently 33,654.
Against this backdrop, the Nasdaq Composite has truly taken flight.
In the process, the index has placed distance atop its 200-day moving average, currently 11,452.
From current levels, last week’s gap (11,904) is followed by the Jan peak (11,691).
Widening the view to six months adds perspective.
On this wider view, the Nasdaq has knifed atop its 200-day moving average, rising to nail the five-month range top (12,270).
Last week’s high (12,269) matched the range top and thus far modest selling pressure has surfaced.
Though near-term extended, the aggressive spike atop the 200-day moving average — (a massive 6.3% technical breakout) — signals a primary trend shift.
Tactically, the Nasdaq’s backdrop supports a bullish bias barring a violation of the 11,450-to-11,490 area.
Looking elsewhere, the Dow Jones Industrial Average has effectively flatlined in recent weeks.
This is the only major benchmark not tagging multi-month highs.
Nonetheless, the index is holding its range top, and has asserted a posture atop its 50-day moving average, currently 33,654.
More broadly, the early-year price action remains rotational, signaling a shift toward growth (Nasdaq) and away from value (Dow industrials) for now.
Meanwhile, the S&P 500 has knifed to five-month highs.
Recent follow-through builds on the late-January trendline breakout.
Tactically, the 4,094-to-4,100 area pivots to support. (See the Dec. peaks (4,100) and the Jan. peak (4,094).)
The bigger picture
As detailed above, the major U.S. benchmarks have taken flight — in key spots — rising amid potentially consequential price action.
On a headline basis, the S&P 500 has extended its trendline breakout, while the Nasdaq Composite has knifed aggressively atop its 200-day moving average.
Moreover, each benchmark has notched a material “higher high” also consistent with a trend shift. (The S&P has tagged a five-month high, the Nasdaq has registered a four-month high.)
Moving to the small-caps, the iShares Russell 2000 ETF (IWM) has extended its breakout, knifing to five-month highs.
Tactically, the breakout point (189.90) pivots to first support.
Delving deeper, the 50- and 200-day moving averages remain inflection points. Recall the golden cross, or 50-day/200-day moving average crossover, to conclude January.
Meanwhile, the SPDR S&P MidCap 400 ETF (MDY) remains incrementally stronger, knifing to 10-month highs amid a volume spike.
Here again, the former range top (475.15) pivots to support.
(On a granular note, the MDY has staged a two standard deviation breakout, notching consecutive closes atop its 20-day volatility bands (not illustrated). Elsewhere, the Nasdaq, S&P 500 and Russell 2000 have each registered a single close atop their respective volatility bands.)
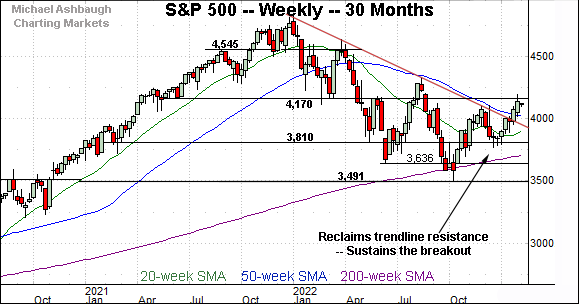
Returning to the S&P 500, this next chart is a weekly view spanning 30 months. Each bar on the chart represents one week.
As illustrated, the S&P 500 has sustained its trendline breakout, notching consecutive weekly closes higher. (The third week is the current week, which hasn’t concluded with a weekly close.)
The prevailing upturn places major resistance (4,170) within view. (The 4,170 area closely matches the June 2022 high, and the June 2021 low.)
(On a stray note, recall the trendline roughly tracks the 50-week moving average, currently 4,021.)
Narrowing to the S&P 500’s six-month view adds perspective.
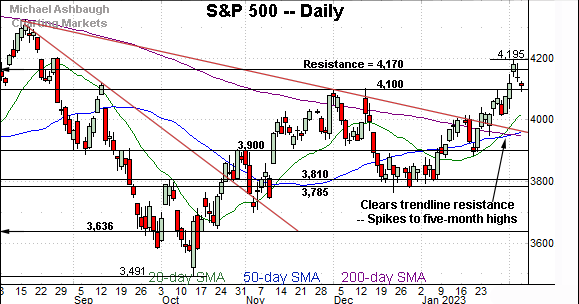
On this daily chart, the S&P 500 has taken flight, knifing to five-month highs. The prevailing upturn punctuates a cup-and-handle defined by the October and December lows.
Against this backdrop, consider the following recent events:
The S&P 500 has knifed aggressively atop its 200-day moving average, amid a 5.8% technical breakout.
The index has registered a material “higher high” versus the Dec. peak.
The upturn marks a bullish two standard deviation breakout, punctuated by a single close atop the 20-day Bollinger bands. (Consecutive closes above the bands more reliably signal a major trend shift.)
The breakout encompassed an unusual 9-to-1 up day to conclude January. (See the Feb. 1 review.)
Combined, the details above signal a primary trend shift.
From current levels, the 4,094-to-4,100 area pivots to support. Monday’s session low (4,093) and Tuesday’s early session low (4,095) have registered nearby.
Delving much deeper, the S&P 3,950 area remains important support. This area matches the late-January low (3,949) — also the post-breakout low (3,949) — as well as the 50-day moving average (3,961) and 200-day moving average (3,946).
Tactically, the S&P 500’s intermediate- to longer-term bias remains bullish barring a violation of the 3,950 area.
Also see Feb. 1: Bull case strengthens amid stealth 9-to-1 up day ahead of Fed.
Watch List
Drilling down further, the SPDR S&P Insurance ETF (KIE) is acting well technically. (Yield = 1.9%.)
Late last month, the group edged to all-time highs, clearing resistance matching the December peak. The subsequent flag-like pattern — the tight two-week range — signals muted selling pressure, positioning the group to extend its uptrend.
Tactically, trendline support is rising toward the breakout point (42.70). The prevailing rally attempt is intact barring a violation.
Looking elsewhere, the iShares U.S. Real Estate ETF (IYR) — profiled Jan. 12 — has come to life technically. (Yield = 3.0%.)
As illustrated, the group has knifed to four-month highs, clearing the 200-day moving average amid increased volume. The subsequent pullback has been orderly, placing the group 3.5% under the February peak.
Tactically, trendline support roughly tracks the 50-day moving average, and is rising toward the breakout point (90.00). A sustained posture higher signals a bullish bias.
Similarly, the SPDR S&P Homebuilders ETF (XHB) — also profiled Jan. 12 — has broken out.
In the process, the group has tagged nearly 52-week highs, its best level since Feb. 9, 2022.
Though near-term extended — and due a cooling-off phase — the recent straightline spike is longer-term bullish. Tactically, the breakout point (66.50) pivots to well defined support.
Finally, Dow 30 component Apple Inc. (AAPL) — profiled last week — has broken out, rising amid a volume spike after the company’s first-quarter results.
Against this backdrop, the shares have cleared trendline resistance closely tracking the 200-day moving average, currently 147.65. The breakout is potentially consequential — (for both Apple, and the broader market) — signaling a primary trend shift.
Tactically, gap support (148.20) is closely followed by the trendline. The prevailing rally attempt is intact barring a violation.


