Charting a bull-bear battle, S&P 500 tags 50-day average
Focus: 10-year yield stages slight breakout, Retail sector retests major support
Technically speaking, selling pressure has accelerated, amid a late-month pullback, placing notable tests in play.
Amid the downturn, the S&P 500 has challenged its 50-day moving average, currently 3,980, while the Nasdaq Composite has concurrently nailed its breakout point (11,492). The pending downside follow-through from current levels, or lack thereof, will likely add color.
Editor’s Note: As always, updates can be directly accessed at https://chartingmarkets.substack.com.
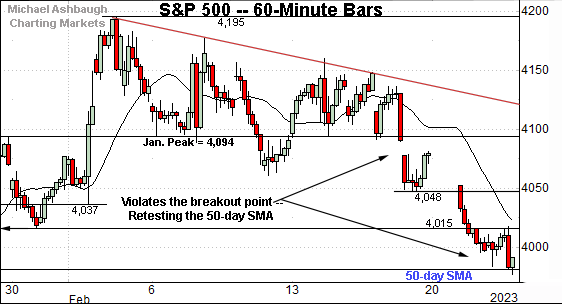
Before detailing the U.S. markets’ wider view, the S&P 500’s hourly chart highlights the past four weeks.
As illustrated, the S&P has extended a downturn from trendline resistance.
The prevailing pullback places the 50-day moving average, currently 3,980, under siege. (Also see the daily chart.)
Meanwhile, the Dow Jones Industrial Average has also turned lower, breaking from a tight February range.
In the process, the index has violated its 50-day moving average, currently 33,594, an area that underpinned the prior range.
From current levels, the 33,240 area pivots to resistance, a level also illustrated on the daily chart.
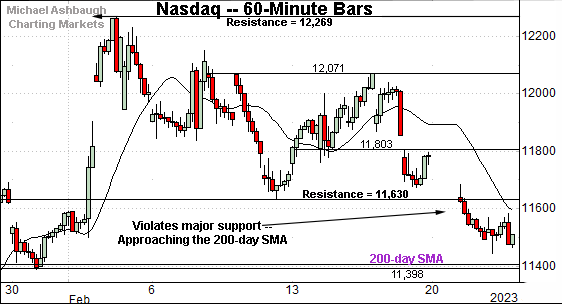
Against this backdrop, the Nasdaq Composite has also extended its February downturn.
Tactically, the breakdown point (11,630) pivots to resistance. (Thursday’s early session high (11,638) has registered nearby.)
Delving deeper, the prevailing downturn places the marquee 200-day moving average within view.
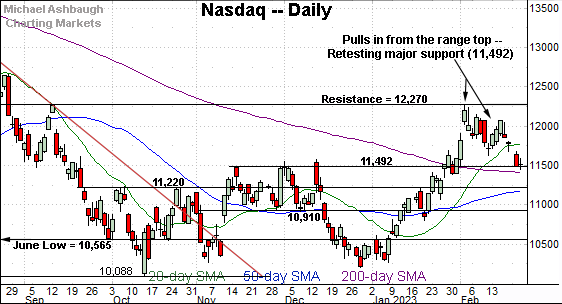
Widening the view to six months adds perspective.
On this wider view, the Nasdaq has nailed its breakout point (11,492), a bull-bear fulcrum detailed repeatedly.
Tuesday’s close (11,492) — also the February closing low — has precisely matched support.
Delving slightly deeper, the 200-day moving average, currently 11,410, remains a related level.
Broadly speaking, the Nasdaq’s backdrop supports a bullish intermediate- to longer-term bias barring a violation of the 11,410-to-11,490 area.
Looking elsewhere, the Dow Jones Industrial Average has tagged one-month lows.
The prevailing downturn punctuates a decisive violation of the 50-day moving average, currently 33,594, a level that underpinned the prior range.
From current levels, the 33,240 area pivots to resistance.
Slightly more broadly, the prevailing pullback punctuates a failed test of the range top (34,342). The February peak (34,334) registered within eight points.
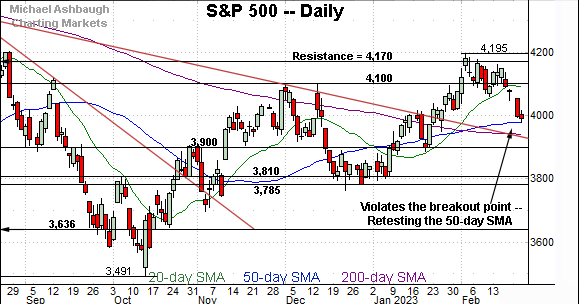
Meanwhile, the S&P 500 has also extended its downturn.
Consider that selling pressure has accelerated amid the violation of the breakout point — the 4,094-to-4,100 area.
More immediately, an extended test of the 50-day moving average, currently 3,980, remains underway.
The bigger picture
As detailed above, the U.S. benchmarks’ prevailing downturn places notable technical tests in play.
On a headline basis, the Nasdaq Composite has nailed its breakout point (11,492) while the S&P 500 has reached an extended test of the 50-day moving average, currently 3,980.
The pending downside follow-through from current levels, or lack thereof, will likely add color. (Elsewhere, the Dow Jones Industrial Average has violated its range bottom, placing distance firmly under the 50-day moving average.)
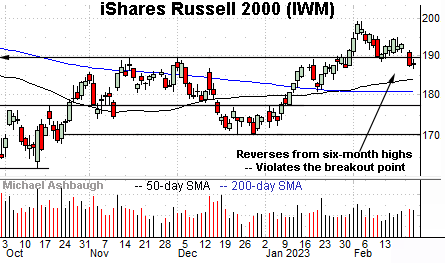
Moving to the small-caps, the iShares Russell 2000 ETF (IWM) has extended a downturn from six-month highs.
In the process, the small-cap benchmark has violated its breakout point (189.90) pressured amid a volume uptick.
Tactically, this area pivots to resistance. A swift reversal higher would strengthen the backdrop.
Meanwhile, the SPDR S&P MidCap 400 ETF (MDY) is retesting major support.
The specific level matches the breakout point (475.15), an area detailed previously. Wednesday’s close (475.24) registered nearby amid an extended retest.
Delving deeper, the 50-day moving average marked a December inflection point, and is rising toward support.
Returning to the S&P 500, the index has extended a late-month downturn.
In the process, the S&P has knifed under its breakout point — the 4,094-to-4,100 area — amid respectable selling pressure.
Consider that Tuesday’s downdraft (long red bar) marked an aggressive 6-to-1 down day. (NYSE declining volume surpassed advancing volume by a 6-to-1 margin.) Though not a textbook 9-to-1 down day, the selling pressure stands out in the year-to-date context.
On further weakness, the 3,940-to-3,950 area remains a more important floor. As detailed repeatedly, this area matches the post-breakout low (3,949), the trendline and the 200-day moving average (3,940).
As always, it’s not just what the markets do, it’s how they do it. But broadly speaking, the S&P 500’s longer-term bias remains bullish barring a violation of the 3,950 area. (Also recall the Nasdaq 11,410-to-11,490 area marks a bull-bear fulcrum.)
Beyond specific levels, the 10-year Treasury note yield’s backdrop — detailed in the next section — remains a market headwind.
Also see Feb. 21: Charting a shaky technical tilt, S&P 500 violates the breakout point.
Editor’s Note: The next review will be published Wednesday, March 1.
Watch List
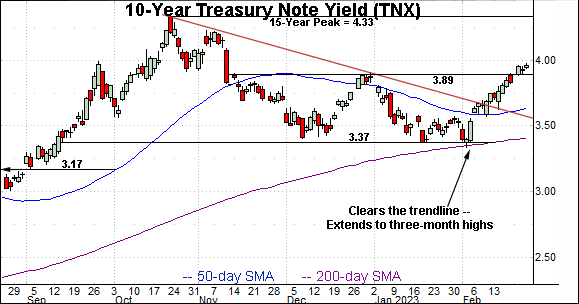
Drilling down further, the 10-year Treasury note yield (TNX) — profiled Feb. 21 — has staged a slight breakout.
In the process, the yield has tagged three-month highs, punctuating a double bottom defined by the December and February lows. The prevailing upturn has been underpinned by the 200-day moving average, signaling a longer-term uptrend.
On further strength, an upside target projects to the 4.40 area, and could be reached relatively swiftly. (Recall round-trips through the prior range spanned about 50 basis points across two to three weeks.)
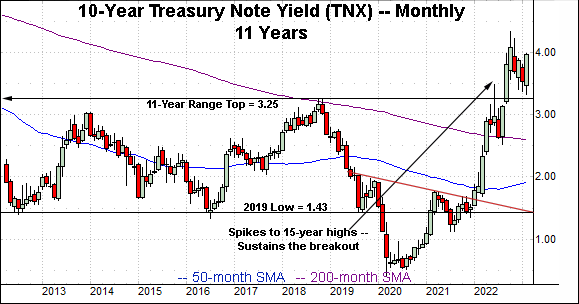
More broadly, the prevailing six-month range marks a flag-like pattern, of sorts, hinged to the massive 2022 spike. Aggressive upside follow-through is possible, as illustrated on the monthly chart.
Concluding on a stray note, the SPDR S&P Retail ETF (XRT) has pulled in to major support.
Specifically, the group is retesting its breakout point (67.20) amid a thus far orderly pullback from six-month highs.
Market bulls might contend that as an early-stage cyclical, the group’s backdrop supports the bull case. (The retail sector is a subset of Consumer Discretionary, and this group tends to outperform amid an economic upturn’s early stages.)
The pending retest of support — across the next several sessions — may add color.
Editor’s Note: The next review will be published Wednesday, March 1.


