Charting market cross currents, S&P 500 asserts higher plateau
Focus: Microsoft and gold sustain breakouts, Consumer staples and crude oil show signs of life, MSFT, GLD, USO, XLP
Technically speaking, market cross currents remain in play as the first-quarter conclusion approaches.
And while the prevailing backdrop is not one-size-fits-all, the S&P 500 seems to have stabilized, asserting a late-month range defined by the 50- and 200-day moving averages. The charts below add color.
Editor’s Note: As always, updates can be directly accessed at https://chartingmarkets.substack.com. Subscribers in 21 countries.
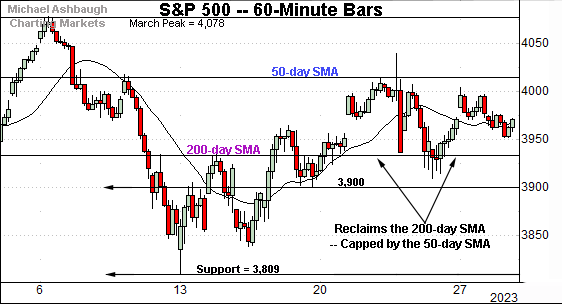
Before detailing the U.S. markets’ wider view, the S&P 500’s hourly chart highlights the past four weeks.
As illustrated, the S&P has asserted a higher plateau.
Tactically, the 200-day moving average, currently 3,932, has underpinned the range on a closing basis.
Conversely, the 50-day moving average, currently 4,014, remains an overhead hurdle.
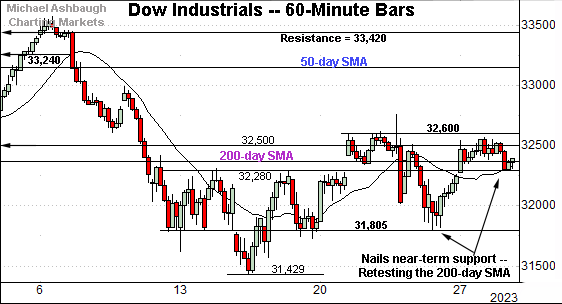
Meanwhile, the Dow Jones Industrial Average is underperforming the other benchmarks.
As illustrated, the index continues to retest its 200-day moving average, currently 32,362.
Delving deeper, the Dow has nailed familiar support (31,805) an area detailed Thursday. Friday’s session low (31,805) precisely matched support.
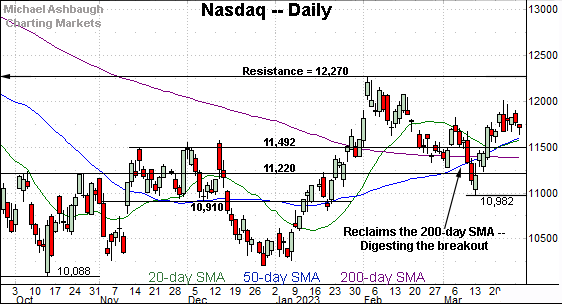
True to recent form, the Nasdaq Composite continues to outpace the other benchmarks.
Tactically, the recent pullback has been orderly, underpinned by support (11,630) detailed last week.
The week-to-date low (11,635) has registered nearby.
Combined, each big three benchmark has maintained a relatively well-defined inflection point. Constructive near-term price action.
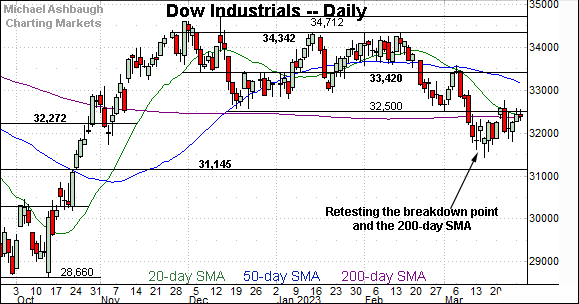
Widening the view to six months adds perspective.
On this wider view, the Nasdaq is digesting a March breakout of sorts.
Tactically, the 11,400-to-11,500 area remains a bull-bear fulcrum. A sustained posture higher signals a bullish bigger-picture bias. (See the 200-day moving average, currently 11,387, and the former breakout point (11,492).)
Conversely, the Dow Jones Industrial Average is digesting a March breakdown.
Recall the recent downturn punctuates a double top defined by the November and February peaks.
Tactically, the 200-day moving average is followed by resistance in the 32,500-to-32,600 area. (See the hourly chart.)
Sustained follow-through atop this area would place the Dow on firmer technical ground.
Against this backdrop, the S&P 500 is digesting a March whipsaw.
In the process, the index has stabilized between the 50- and 200-day moving averages for now.
The bigger picture
As detailed above, the major U.S. benchmarks are approaching the first-quarter conclusion (March 31) in divergence mode.
On a headline basis, the Nasdaq Composite has sustained a March breakout, while the Dow Jones Industrial Average is digesting a March downdraft. The two benchmarks have traded places versus their posture to conclude last year. (See the 200-day moving average.)
Meanwhile, the S&P 500 has asserted a late-March range defined by the 50- and 200-day moving averages. The bigger-picture backdrop is not one-size-fits-all.
Moving to the small-caps, the iShares Russell 2000 ETF (IWM) has survived an extended test of major support, an area matching the Dec. low (170.34).
Still, the recent rally attempts have been flat, and fueled by decreased volume. Shaky price action. Eventual downside follow-through remains a prospect based on today’s backdrop.
Similarly, the SPDR S&P MidCap 400 ETF (MDY) has maintained its range bottom.
But here again, the recent rallies attempts have been flat, and capped by 200-day moving average, currently 447.60. Eventual follow-through atop the 200-day would place the MDY on firmer footing.
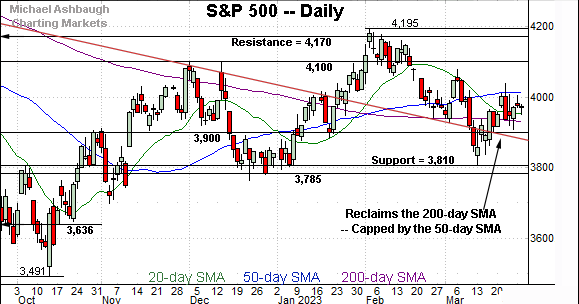
Returning to the S&P 500, the index has stabilized to punctuate a respectable March whipsaw.
The early-month spike — briefly atop the 50-day moving average — concluded with a downdraft to major support (3,810).
But amid the volatility, consider that Tuesday’s close (3,971) effectively matched the February close (3,970). The index has notched a flat month-to-date performance.
Against this backdrop, the bigger-picture technicals not entirely straightforward. The early-month downdraft was fueled by aggressive selling pressure, and punctuated by a comparably less impressive rally attempt thus far.
Nonetheless, price action is paramount, and the S&P 500’s late-month price action is sufficient to support a guardedly-bullish bias. Tactically, the S&P 3,935 area remains a bull-bear fulcrum — detailed repeatedly — matching two inflection points:
The 200-day moving average, currently 3,932.
The mid-point of the prevailing range (3,942).
Notably, this area underpinned last week’s Fed-induced whipsaw — (see the long red bar, punctuated by a session close of 3,937) — preserving the S&P 500’s recovery attempt for now. Looking ahead, Friday’s first-quarter close, and the subsequent turn-of-the-month price action will likely add color.
Editor’s Note: The next review will be published Tuesday, April 4.
Watch List
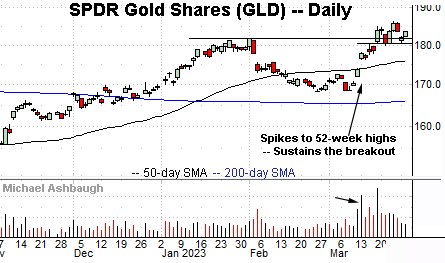
Drilling down further, the SPDR Gold Shares ETF (GLD) has asserted a bull flag, a pattern hinged to the strong-volume mid-March rally.
Tactically, the breakout point (181.70) is closely followed by gap support (180.80), areas detailed last week.
This week’s low (180.69) has registered nearby amid a successful retest.
More broadly, the shares are approaching a 30-month range top detailed on the weekly chart. To reiterate, the 185.95-to-186.10 area marks major resistance. The pending response to this area will likely add color. As always, the chances of a breakout improve to the extent the shares hold tightly to resistance.
Meanwhile, the United States Oil Fund (USO) has reversed course, rising as global-growth concerns recede. (Or at least as the apocalyptic scenario seems to have been averted.)
In the process, the shares have reclaimed the breakdown point, placing the brakes on bearish momentum.
On further strength, the 50-day moving average (66.62) is followed by trendline resistance. Eventual follow-through atop the trendline — (which does not look likely, based on today’s backdrop) — would signal an intermediate-term trend shift.
Moving to U.S. sectors, the Consumer Staples Select Sector SPDR (XLP) — profiled last week — is showing signs of life. (Yield = 2.6%.)
As illustrated, the group has edged atop trendline resistance, a level closely matching the 50-day moving average (72.78) and 200-day moving average (72.92).
The upturn places the January breakdown point (73.80) under siege.
Tactically, the trendline pivots to support. The group’s breakout attempt is intact barring a violation.
Finally, Microsoft Corp. (MSFT) is a well positioned Dow 30 component.
Earlier this month, the shares knifed to seven-month highs, rising amid a volume spike. The subsequent bull flag — (the tight late-March range) — signals muted selling pressure, positioning the shares to build on the initial spike.
Tactically, a sustained posture atop the range bottom (272.00) signals a firmly-bullish bias.
More broadly, notice the recent golden cross — or bullish 50-day/200-day moving average crossover — signaling the intermediate-term uptrend has overtaken the longer-term trend. (Interestingly, Microsoft’s two-month backdrop is not too different from gold’s backdrop detailed previously.)
Also see Microsoft’s two-year chart (below) signaling a recent trend shift exemplified by the 20- and 100-week moving averages.


