Charting a market divergence, Nasdaq vies to reassert leadership
Focus: Gold takes flight, Crude oil turns lower, Semiconductor sector stages stealth breakout attempt, GLD, USO, SMH
Technically speaking, the major U.S. benchmarks have diverged in the wake of a March volatility spike.
Against this backdrop, the Nasdaq Composite is exhibiting relative strength — amid market rotation — as the S&P 500 vies to sustain a lukewarm reversal atop its 200-day moving average.
Editor’s Note: As always, updates can be directly accessed at https://chartingmarkets.substack.com. Subscribers in 21 countries.
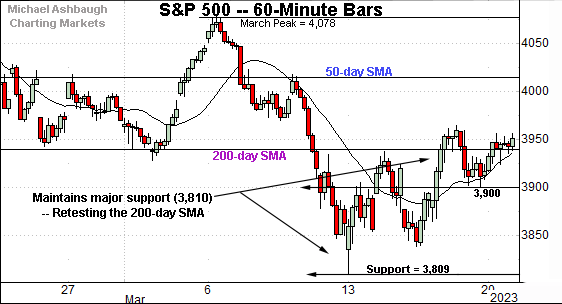
Before detailing the U.S. markets’ wider view, the S&P 500’s hourly chart highlights the past four weeks.
As illustrated, the S&P has extended a jagged upturn from major support (3,810).
In the process, the index has ventured back atop its 200-day moving average, currently 3,936.
As always, the 200-day moving average is a widely-tracked longer-term trending indicator.
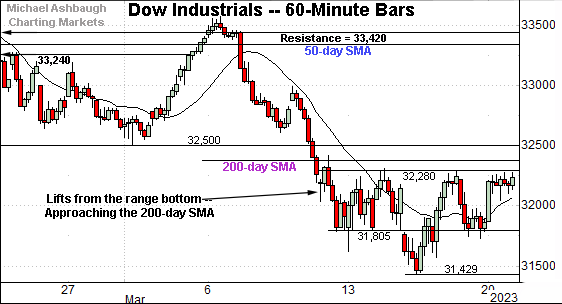
Meanwhile, the Dow Jones Industrial Average remains relatively weaker on this near-term view.
But here again, the index is approaching its 200-day moving average, currently 32,370.
Slightly more distant overhead matches the breakdown point (32,500) an area also detailed on the daily chart.
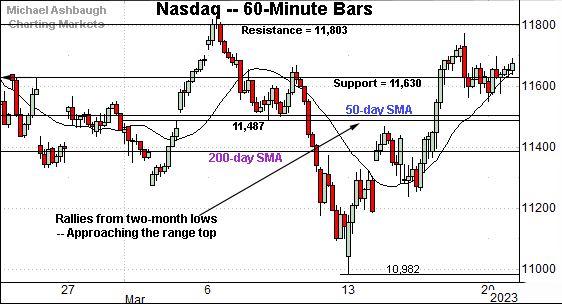
Against this backdrop, the Nasdaq Composite has diverged from the other benchmarks.
In the process, the index has knifed toward its range top, placing distance atop the 50- and 200-day moving averages.
Both areas are also detailed on the daily chart below.
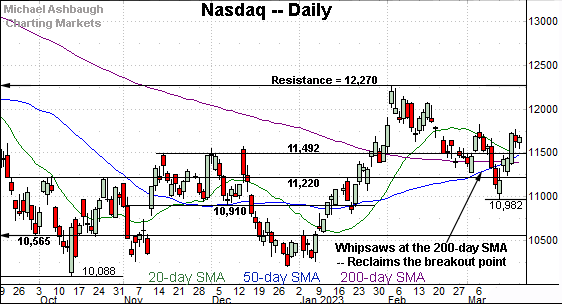
Widening the view to six months adds perspective.
On this wider view, the Nasdaq has knifed from two-month lows, rising to reclaim three inflection points:
The former breakout point (11,492).
The 50-day moving average, currently 11,502.
The 200-day moving average, currently 11,390.
Moreover, the immediate pullback has been comparably flat as the index vies to stabilize. Constructive price action.
Tactically, the 11,400-to-11,500 area broadly remains a bull-bear fulcrum.
Looking elsewhere, the Dow Jones Industrial Average is digesting the March downdraft.
Recall the downturn punctuates a double top defined by the November and February peaks.
Tactically, the 200-day moving average, currently 32,370, is followed by the slightly more distant breakdown point (32,500). Sustained follow-through atop this area would mark a step toward stabilization.
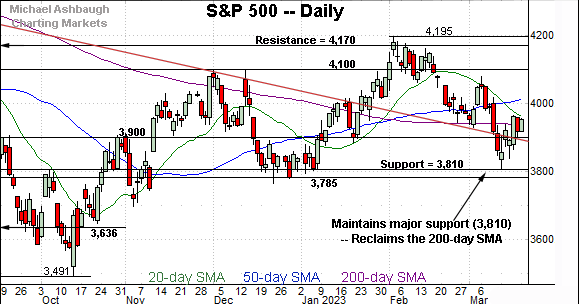
Meanwhile, the S&P 500 is vying to stabilize amid a recent whipsaw.
The prevailing upturn originates from major support (3,810) detailed repeatedly. The March low (3,909) registered within one point.
More immediately, the S&P has reclaimed its trendline, and continues to retest the 200-day moving average, currently 3,936.
The bigger picture
As detailed above, the major U.S. benchmarks have diverged amid a March volatility spike.
Against this backdrop, the Nasdaq Composite and Dow industrials may be poised to trade places after the Dow previously outperformed to conclude last year. (The Dow has violated its 200-day moving average as the Nasdaq has reclaimed its 200-day. See the daily charts.)
Fundamentally, the prospect of easing interest rates — or at least less-hawkish central bank policies — has fueled a rotation toward growth stocks and away from value for now.
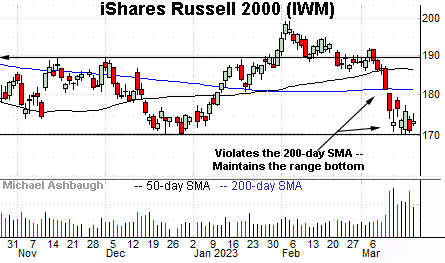
Moving to the small-caps, the iShares Russell 2000 ETF (IWM) has survived an important technical test. At least so far.
Specifically, the shares have maintained major support matching the Dec. low (170.34).
The March low (170.38) has registered fractionally above support.
Tactically, the quality of the rally from this area should be a useful bull-bear gauge. The 200-day moving average, currently 181.14, marks an overhead inflection point.
Similarly, the SPDR S&P MidCap 400 ETF (MDY) has maintained its range bottom, an area matching the Dec. low (433.04).
But here again, the quality of its rally attempt remains an open question.
Tactically, upside follow-through atop the 200-day moving average, currently 448.10, would place the shares on firmer technical ground.
Combined, the small- and mid-caps have plunged through their ranges — across just three sessions — and the initial rally attempt has been comparably flat. Shaky price action.
Returning to the S&P 500, the index is vying to stabilize amid a recent volatility spike.
The prevailing upturn punctuates a successful test of major support (3,810).
Nonetheless, the quality of the prevailing rally attempt — as measured by volume, breadth, sector participation and price action — thus far gets mixed marks for style at best.
The recent upturn has been fueled by decreased relative volume, lackluster internal strength and narrow sector participation.
Against this backdrop, the upturn’s most important element — price action — is a bright spot of sorts.
The S&P has rallied from major support (3,810) — reasserted the 3,900 mark as support — and ventured back atop the 200-day moving average, currently 3,936.
So collectively, the prevailing rally attempt’s durability remains a question mark.
But against this backdrop, the S&P 3,935 area remains a useful bull-bear fulcrum.
Broadly speaking, a sustained posture higher signals a bullish-leaning intermediate- to longer-term bias. The response to Wednesday’s Federal Reserve policy decision will likely add color.
Also see March 15: S&P 500 violates 200-day average amid tandem 9-to-1 down days.
Watch List
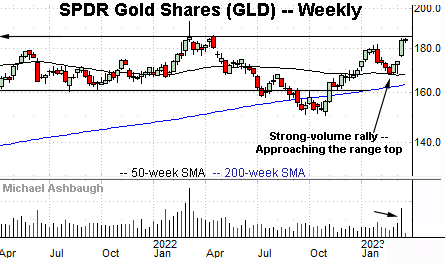
Drilling down further, the SPDR Gold Shares ETF (GLD) — profiled last week — has broken out, tagging 11-month highs amid a safe-haven trade.
From current levels, the breakout point (181.70) is closely followed by gap support (180.80). Delving deeper, the 50-day moving average, currently 175.10, is rising toward the mid-month gap (176.30). A sustained posture higher signals a bullish intermediate-term bias.
More broadly, the shares are approaching a 30-month range top detailed on the weekly chart. Tactically, the 185.95-to-186.10 area marks major resistance. The pending selling pressure in this area, or lack thereof, will likely add color.
Elsewhere, the United States Oil Fund (USO) has turned lower, pressured at least partly amid global-growth concerns.
In the process, the shares have tagged 14-month lows, violating well-defined support.
More broadly, the shares have ventured under the 200-week moving average, currently 60.75, an area that formerly offered support. (See the weekly chart.)
Tactically, the 61.80-to-62.30 area pivots to notable resistance. A reversal atop this area would place the brakes on bearish momentum.
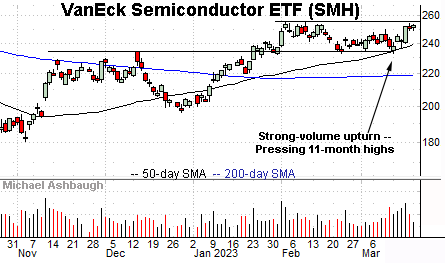
Concluding with a U.S. sector, the VanEck Semiconductor ETF (SMH) is acting well technically.
As illustrated, the group is pressing 11-month highs, rising amid recently increased volume.
The prevailing upturn punctuates an orderly seven-week range, hinged to the early-February strong-volume spike.
Tactically, the response to the range top (255.60) is worth tracking. A near-term target projects to the 275 area on follow-through. Conversely, an eventual violation of the 50-day moving average, currently 239.90, would raise a caution flag.
Summing up the backdrop
Combined, the pronounced gold/oil divergence exemplifies market stress, though the semiconductor sector stands out (perhaps paradoxically) as a pocket of relative strength.


