Charting a bull-bear battle, S&P 500 nails 200-day average as volatility persists
Focus: 10-year yield maintains key trendline, U.S. sector cross currents persist, TNX, XLF, XLB, XLU, IYR, XLP, QQQ
Technically speaking, the major U.S. benchmarks continue to vacillate amid a prolonged March whipsaw.
Against this backdrop, the S&P 500 and the 10-year Treasury note yield have concurrently nailed important levels — their respective 200-day moving averages — signaling a bull-bear stalemate after the Federal Reserve’s policy statement. At least for now.
Editor’s Note: As always, updates can be directly accessed at https://chartingmarkets.substack.com.
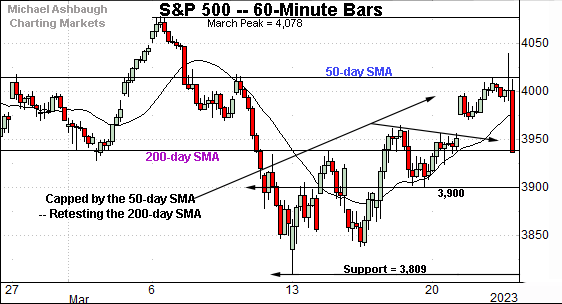
Before detailing the U.S. markets’ wider view, the S&P 500’s hourly chart highlights the past four weeks.
As illustrated, the S&P has whipsawed amid two widely-tracked levels.
To start, the 50-day moving average, currently 4,015, has capped the recovery attempt.
Conversely, the S&P appears to have weathered a retest of the 200-day moving average, currently 3,934, following the Fed’s latest policy statement. Both areas are also detailed on the daily chart.
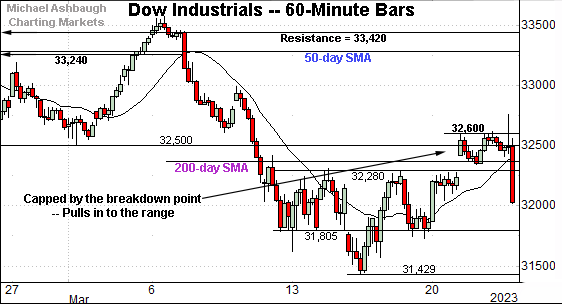
Meanwhile, the Dow Jones Industrial Average remains comparably weaker on this near-term view.
As illustrated, the index has registered a jagged test of the breakdown point (32,500), ultimately pulling in immediately after the Fed.
Amid the volatility, an extended retest of the 200-day moving average, currently 32,364, remains underway.
Against this backdrop, the Nasdaq Composite continues to outpace the other benchmarks.
In fact, the index briefly tagged one-month highs after the Fed, before pulling back in to its range.
The prevailing upturn places the index firmly atop its 50- and 200-day moving averages, unlike the other benchmarks.
Widening the view to six months adds perspective.
On this wider view, the Nasdaq has sustained a break atop three inflection points:
The former breakout point (11,492).
The 50-day moving average, currently 11,548.
The 200-day moving average, currently 11,389.
Amid the upturn, notice the recent golden cross, or bullish 50-day/200-day moving average crossover. Though frequently a lagging indicator, the crossover signals the intermediate-term uptrend has overtaken the longer-term trend.
Tactically, the 11,400-to-11,500 area broadly remains a bull-bear fulcrum. A sustained posture higher signals a bullish bigger-picture bias.
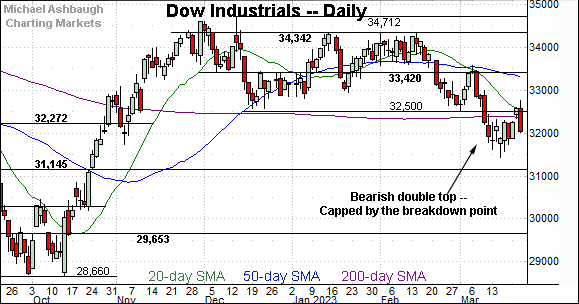
Looking elsewhere, the Dow Jones Industrial Average is digesting the March downdraft.
Recall the downturn punctuates a double top defined by the November and February peaks.
Tactically, the index has thus far struggled to reclaim its 200-day moving average, currently 32,364, a level closely followed by the breakdown point (32,500). Sustained follow-through atop this area would place the Dow on firmer technical ground.
Meanwhile, the S&P 500 has whipsawed amid widely-tracked technical levels.
To start, the recent upturn originates from major support (3,810). The March low (3,909) registered within one point.
Conversely, the rally attempt has stalled near the 50-day moving average, currently 4,015.
More broadly, market bears might point to a developing head-and-shoulders top defined by the December, February and March peaks.
The bigger picture
As detailed above, the major U.S. benchmarks remain in divergence mode.
On a headline basis, the Nasdaq Composite has strengthened in recent sessions, reclaiming its 200-day moving average amid market rotation.
Conversely, the Dow industrials’ backdrop has softened, as the index remains capped by its 200-day moving average. (See the daily charts.)
Amid the cross currents, the S&P 500’s backdrop — the most representative major benchmark — splits the difference between the other two. The S&P has almost precisely tagged its 200-day moving average after the Fed’s policy directive. (The 10-year Treasury note yield also nailed its 200-day moving average as detailed in the next section.)
Moving to the small-caps, the iShares Russell 2000 ETF (IWM) has maintained major support.
Tactically, the Dec. low (170.34) defines the range bottom. The March low (170.38) has registered nearby.
But the subsequent rally from support has thus far been flattish. Moreover, recent daily downturns have been fueled by increased volume.
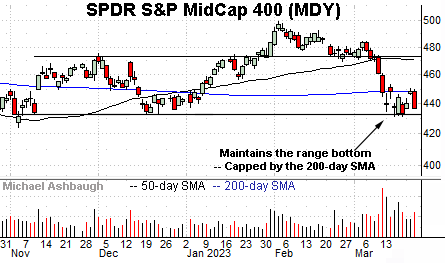
Similarly, the SPDR S&P MidCap 400 ETF (MDY) has maintained its range bottom, placing the brakes on the mid-March downdraft.
Still, the subsequent rally attempt has been flat, and capped by the 200-day moving average, currently 447.86. Shaky price action.
Eventual upside follow-through atop the 200-day would place the MDY on firmer footing.
Returning to the S&P 500, the index has whipsawed amid a March volatility spike.
The recent upturn originates from major support (3,810) at the March low.
Conversely, the rally attempt has stalled near the 50-day moving average, currently 4,015.
Beyond technical levels, recall the S&P 500’s prior downturn was punctuated by consecutive 9-to-1 down days as the S&P violated its 200-day moving average. (This marks unusually aggressive selling pressure, consistent with a primary downtrend.)
By comparison, the subsequent rally attempt remains uninspiring as measured by volume, breadth and sector participation.
Against this backdrop, the S&P 3,935 area remains a bull-bear fulcrum, detailed previously, closely matching two inflection points:
The 200-day moving average, currently 3,934.
The mid-point of the prevailing range (3,942).
With these areas detailed, the S&P closed Wednesday at 3,937 to conclude the customary Fed-induced market whipsaw.
Based on today’s backdrop, a bull-bear stalemate seems to be in play pending the next several sessions.
Editor’s Note: The next review will be published Wednesday, March 29.
Watch List
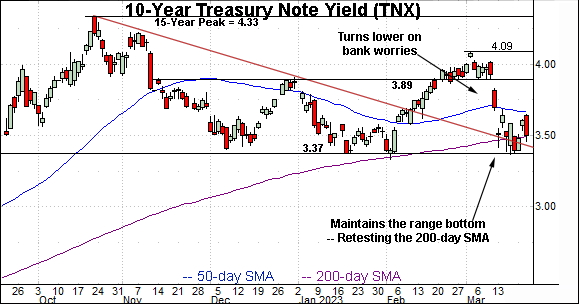
Drilling down further, the 10-year Treasury note yield (TNX) is digesting the March downdraft.
In the process, the yield has maintained several key levels, detailed previously. (See the March 15 review.) Three areas stand out:
The six-month range bottom (3.37).
Trendline support.
The 200-day moving average, currently 3.49.
Against this backdrop, the March low (3.37) has matched the range bottom.
More immediately, Wednesday’s close (3.50) effectively matched the 200-day moving average after the Federal Reserve’s latest policy directive.
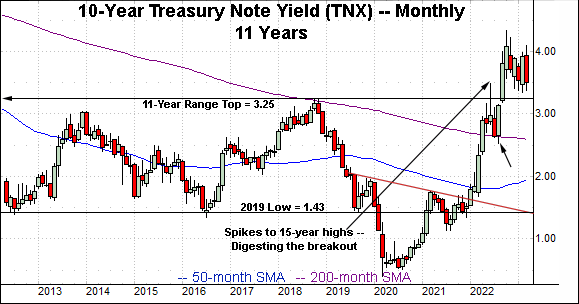
More broadly, the yield’s former range top (3.25) — detailed on the monthly chart — rests slightly under the prevailing range. Tactically, the yield’s longer-term bias remains range-bound to higher barring a violation of these areas.
Moving to U.S. sectors, the Financial Select Sector SPDR (XLF) continues to digest the March downdraft.
Tactically, the post-breakdown peak (32.34) is followed by the firmer breakdown point (33.20). A reversal atop these areas would mark a step toward stabilization.
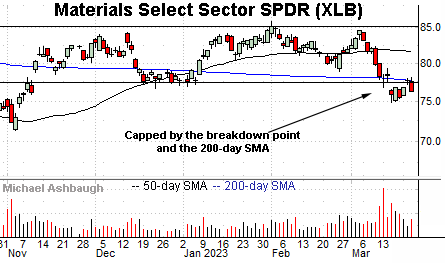
Meanwhile, the Materials Select Sector SPDR (XLB) has tagged four-month lows. The group’s subsequent rally attempt has been fueled by decreased volume, and capped by resistance.
Tactically, the 200-day moving average, currently 77.62, closely matches the breakdown point. A sustained rally atop this area would strengthen the backdrop.
Rate-sensitive sectors signal central banks may remain hawkish
Looking elsewhere, the rate-sensitive sectors are trending lower, consistent with the view that interest rates may stay higher longer than currently expected.
As Treasury yields rise — or remain relatively high — the rate-sensitive sectors’ dividend yield looks comparably less attractive, generally sending then lower. Three groups exemplify the backdrop:
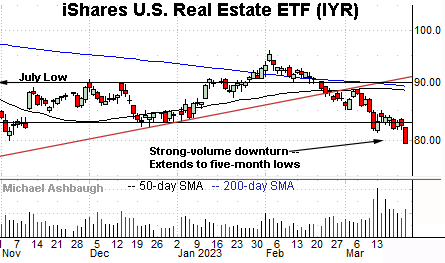
To start, the iShares U.S. Real Estate ETF (IYR) has tagged five-month lows. (Yield = 2.8%.)
The prevailing downturn has been fueled by a sustained volume increase. Tactically, the 81.40-to-83.00 area pivots to resistance.
Meanwhile, the Utilities Select Sector SPDR (XLU) has not yet registered new lows. (Yield = 3.2%.)
Still, the group is trending lower, pressured amid recently increased volume.
Tactically, the 50-day moving average, currently 67.60, roughly tracks trendline resistance, and is followed by the group’s former breakdown point (69.60).
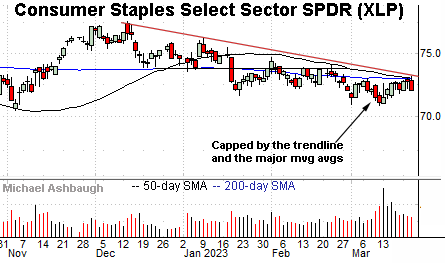
Scaling up slightly in strength, the Consumer Staples Select Sector SPDR (XLP) has registered flattish March price action. (Yield = 2.6%.)
But here again, the group remains capped by trendline resistance hinged to the December peak.
Tactically, the trendline closely matches the 50-day moving average (72.90) and 200-day moving average (72.94). Follow-through atop this area would raise the flag to a trend shift. (The XLP’s recent volume trends are also more favorable than those of the other groups.)
Large-cap technology remains a bright spot
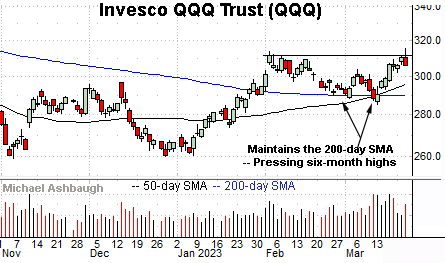
Concluding with a bright spot, the Invesco QQQ Trust (QQQ) tracks the Nasdaq 100 Index offering a large-cap technology sector proxy.
As illustrated, the QQQ is challenging nine-month highs. The prevailing upturn punctuates a successful test of the 50- and 200-day moving averages.
Tactically, a retest of the range top — the 311.70-to-313.70 area — remains underway. An intermediate-term target projects to the 335 area on follow-through.
Within technology, the semiconductor sector — detailed Tuesday — continues to act well technically.


