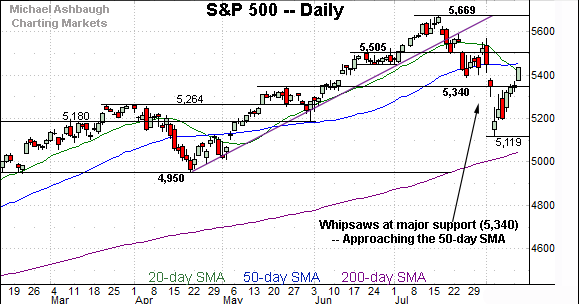
Charting a volatility spike, S&P 500 whipsaws at major support (5,340)
Focus: August downdraft punctuated by powerful 12-to-1 down day
Technically speaking, the major U.S. benchmarks are rising in the wake of a damaging August downdraft.
Amid the volatility, each benchmark has violated several key technical levels, pressured amid market internals that, at times, have registered bearish extremes. The charts below add color:
Editor’s Note: As always, updates can be directly accessed at chartingmarkets.substack.com.
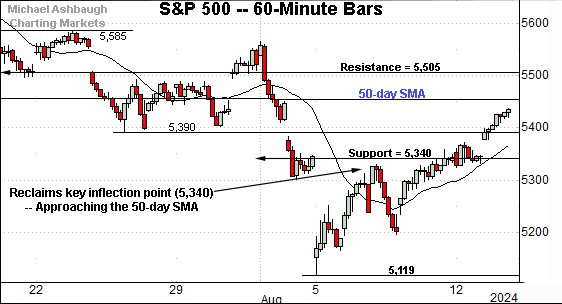
Before detailing the U.S. markets’ wider view, the S&P 500’s hourly chart highlights the past four weeks.
As illustrated, the S&P 500 has whipsawed amid an August volatility spike.
In the process, the index has reclaimed its breakdown point (5,340) an area better illustrated on the daily chart.
On further strength, the 50-day moving average, currently 5,455, marks an inflection point.
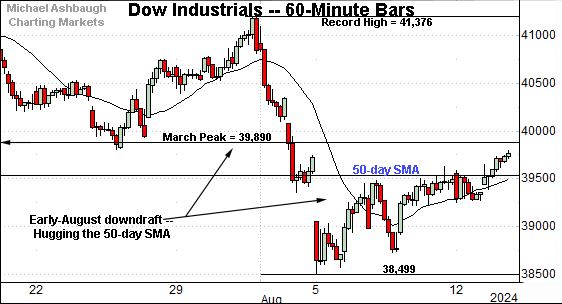
Similarly, the Dow Jones Industrial Average is digesting an August downdraft.
Despite a sluggish rally off recent lows, the index has managed to reclaim its 50-day moving average, currently 39,542.
On further strength, the breakdown point (39,890) rests within view, an area also detailed on the daily chart. The pending retest from underneath may add color.
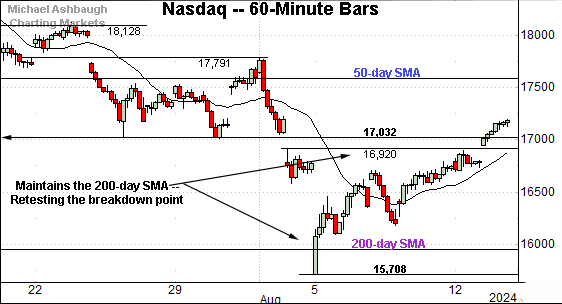
Against this backdrop, the Nasdaq Composite has registered a wide-ranging August whipsaw.
Amid the upturn, the index has reclaimed its breakdown point (17,032) — an area detailed previously — and also illustrated on the daily chart below. (See the July 31 review.)
(On a granular note, consider the Aug. 14 session low (17,032) has precisely matched support.)
Widening the view to six months adds perspective.
On this wider view, the Nasdaq has registered a headline technical event, tagging its 200-day moving average, a widely-tracked longer-term trending indicator.
The sharp reversal off the August low preserves a bullish longer-term bias. At least based on today’s backdrop.
More broadly, the prevailing downturn has been aggressive, punctuated by a pronounced volatility spike. The July trendline violation has been followed by a wide-ranging whipsaw at the breakdown point (17,032).
Tactically, the Nasdaq’s intermediate-term bias remains bearish pending sustained follow-through atop the 50-day moving average, currently 17,560.
Beyond specific levels, an aggressive intermediate-term downdraft has clashed with the primary uptrend. This presents a low risk/reward (unattractive) backdrop for establishing large longer-term positions.
(Before August, the Nasdaq had not touched its 200-day moving average since Oct. 2023. It has not registered more than three straight closes under the 200-day since Jan. 2023.)
Looking elsewhere, the Dow Jones Industrial Average has pulled in to its former range.
Still, the prevailing upturn places it back atop the 50-day moving average, currently 39,542. This is the only major benchmark to reclaim its 50-day. At least so far.
On further strength, the breakdown point — broadly, the 39,890-to-40,075 area — marks notable resistance. Sustained upside follow-through atop this area would strengthen the bull case. (Once again, see the Aug. 14 session high.)
Meanwhile, the S&P 500 has also registered an August whipsaw.
Amid the volatility, the 5,340 area remains a nearby inflection point. (See the July 17 review.)
Note the Aug. 2 close (5,346) as well as the Aug. 9 close (5,344) and Aug 12 close (5,344). The Aug. 2 and Aug. 9 closes marked weekly closes.
The bigger picture
As detailed above, the major U.S. benchmarks are digesting a technically-damaging August downdraft.
Each benchmark has violated several key technical levels, pressured amid market internals that, at times, have registered bearish extremes. Perhaps most notably, the Aug. 5 downturn marked a rare 12-to-1 down day, placing each big three U.S. benchmark at multi-month lows. (NYSE declining volume surpassed advancing volume by a 12-to-1 margin.)
Comparably bullish internals have not yet registered amid the prevailing recovery attempt.
So collectively, each benchmark’s backdrop is different, but very generally, the prevailing technicals support a bearish (guarded) intermediate-term bias within the context of longer-term uptrend.
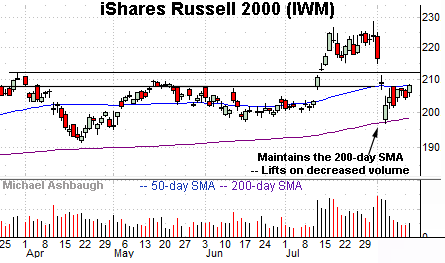
Moving to the small-caps, the iShares Russell 2000 ETF (IWM) is also digesting an August downdraft.
The initial plunge has been underpinned by the 200-day moving average, currently 198.60, a widely-tracked longer-term trending indicator. (A successful test on the first approach would be expected.)
More immediately, the prevailing rally attempt has been sluggish, fueled by decreased volume.
Tactically, upside follow-through atop the 50-day moving average, currently 208.10, and the breakdown point (211.90) would place the small-caps on firmer ground.
Similarly, the SPDR S&P MidCap 400 ETF (MDY) has plunged to its former range.
Here again, the downturn has been underpinned by the 200-day moving average, currently 518.50.
More immediately, the 50-day moving average, currently 541.30, has capped the recovery attempt. The 50-day closely matches gap resistance (542.40). (Recall the July breakout originated from the 50-day moving average for both the small- and mid-caps.)
Combined, the small- and mid-caps have preserved the longer-term uptrend amid successful tests of the 200-day moving average. Still, downside follow-through remains a prospect amid a thus far lackluster recovery attempt.
Returning to the S&P 500, the index has registered a shaky technical turn.
On a headline basis, the July trendline violation has been punctuated by follow-through below the 50-day moving average, and a subsequent downdraft under major support (5,340).
From current levels, the 50-day moving average, currently 5,455, is followed by the 5,505 resistance. This area marks an intermediate-term fulcrum. Price action under this area supports a bearish intermediate-term bias. (And sustained follow-through above this area strengthens the bull case.)
Conversely, the 5,340 area — detailed previously — remains a downside inflection point. (See the Aug. 2 close (5,346) as well as the Aug. 9 close (5,344) and Aug 12 close (5,344). The Aug. 2 and Aug. 9 closes marked weekly closes.)
Tactically, the S&P’s capacity to maintain the 5,340 area, or lack thereof, should also mark a useful bull-bear gauge.
Beyond specific levels, August and September are the worst two months seasonally, and August has thus far registered true to form.
Also see July 30: Market rotation persists, Nasdaq violates 50-day average.


