Bull trend bends (but hasn't broken) as cracks surface in the sector backdrop
Focus: Key sectors violate major support, Japan and Emerging Markets trend lower, U.S. dollar's breakout attempt, XLE, XME, XBI, XLF, QQQ, TRAN, EWJ, EEM, UUP
U.S. stocks are higher mid-day Friday, rising to punctuate a respectable week-to-date downturn amid hawkish Federal Reserve policy signals and lackluster economic data.
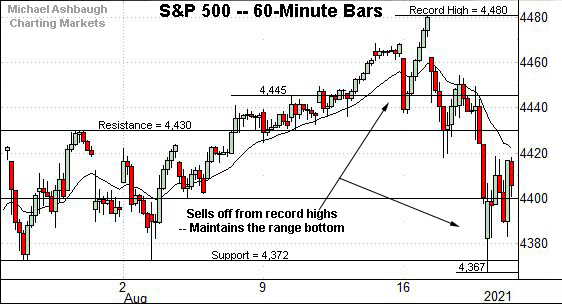
Against this backdrop, the S&P 500 has weathered a sharp pullback from record highs, maintaining familiar support (4,372).
Before detailing the U.S. markets’ wider view, the S&P 500’s hourly chart highlights the past four weeks.
As illustrated, the S&P has pulled in relatively sharply from its record high established Monday.
The downturn has thus far been underpinned by the range bottom (4,372).
The week-to-date low (4,367) — also the August low — has registered nearby.
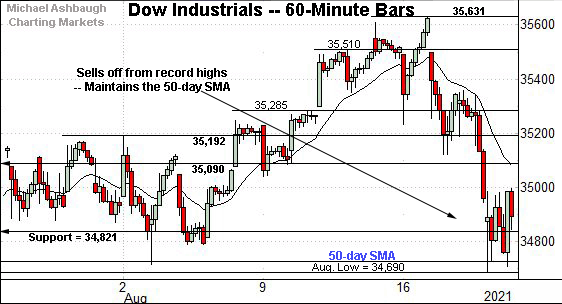
Similarly, the Dow Jones Industrial Average has reversed relatively aggressively from its record high.
The downturn has been underpinned by the 50-day moving average, currently 34,725, an area also illustrated on the daily chart.
Tactically, notable resistance matches the May peak (35,091).
Friday’s early session high (35,097) registered nearby.
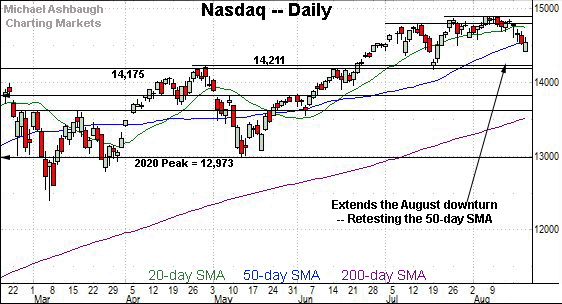
Against this backdrop, the Nasdaq Composite has weathered a shaky test of its range bottom (14,503).
Separately, the index has whipsawed at its 50-day moving average, currently 14,561, venturing lower for the first time since June.
Widening the view to six months adds perspective.
On this wider view, the Nasdaq has extended its August downturn. An extended test of the 50-day moving average, currently 14,561, remains underway to conclude this week.
Delving deeper, likely last-ditch support broadly spans from 14,175 to 14,211.
The July low (14,178) closely matched support.
As detailed previously, a violation of this area would mark a material “lower low” — combined with a violation of the 50-day moving average — raising a technical caution flag.
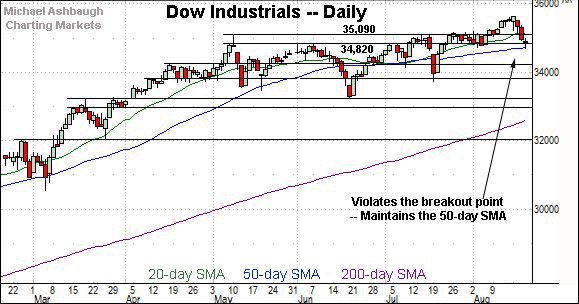
Looking elsewhere, the Dow Jones Industrial Average has pulled in to its range from record highs.
Tactically, the downturn has been underpinned by the former range top (34,820) and the 50-day moving average, currently 34,725, on a closing basis.
Similarly, the S&P 500 has extended its pullback from Monday’s record high.
To reiterate, the downturn has been underpinned by the range bottom (4,372).
The bigger picture
As detailed above, the major U.S. benchmarks have thus far weathered a respectable mid-August market downturn.
Amid the pullback, the Dow industrials and Nasdaq Composite have tagged their 50-day moving average, while the S&P 500 has maintained familiar support (4,372).
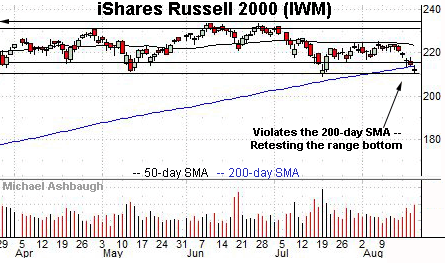
Moving to the small-caps, the iShares Russell 2000 ETF has closed under its 200-day moving average, currently 214.05, for the first time since September 2020.
Delving deeper, the July lows — at 209.05 and 211.73 — remain key inflection points. To reiterate, an eventual violation would mark a material “lower low” signaling a primary trend shift.
(Note: The SPDR S&P MidCap 400 ETF is omitted from this review to save space. The MDY remains range-bound.)
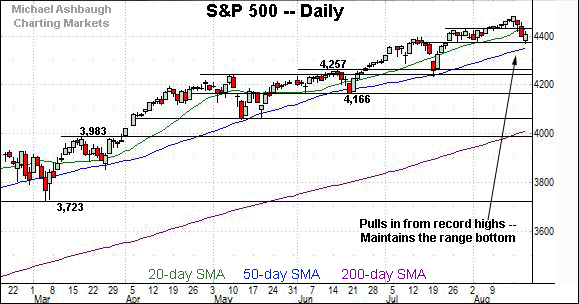
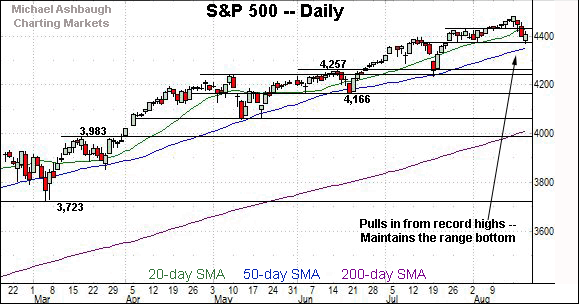
Returning to the S&P 500’s six-month view, the index has pulled in to its former range from recent record highs.
To reiterate, the range bottom (4,372) has underpinned the initial pullback. Limited damage has thus far been inflicted in the broad sweep.
On further weakness, the ascending 50-day moving average, currently 4,352, has effectively defined the prevailing bull trend. As detailed repeatedly, prior retests have marked intermediate-term lows going back to October.
Delving deeper, familiar last ditch-support matches the June breakout point (4,257) and the July closing low (4,258). Broadly speaking, the S&P 500’s intermediate-term bias remains bullish barring a violation of this area.
Beyond specific levels, the U.S. sub-sector backdrop has softened this week as partly detailed in the next section. The prevailing downturn is worth tracking for potential acceleration.
Watch List — Cracks surface in the sector backdrop
Drilling down further, the U.S. sub-sector backdrop has softened amid the mid-August market downturn. Three groups exemplify a deteriorating backdrop:
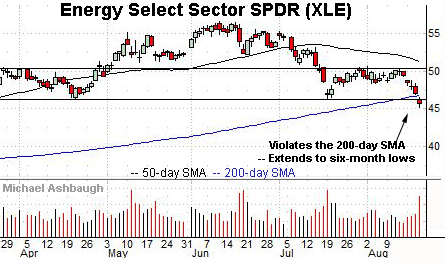
To start, the Energy Select Sector SPDR has violated its 200-day moving average and a six-month range bottom.
The downturn punctuates a head-and-shoulders top defined by the March, June and August peaks.
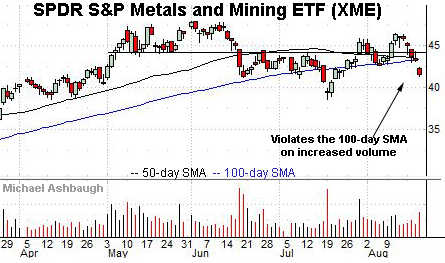
Meanwhile, the SPDR S&P Metals and Mining ETF has violated its 100-day moving average, gapping lower on increased volume.
Note this is the only sector chart to detail a 100-day moving average rather than a 200-day moving average. The 100-day has marked an inflection point, likely contributing to the strong-volume gap lower.
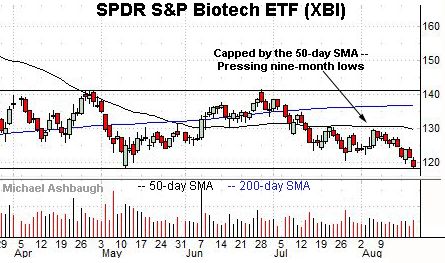
Looking elsewhere, the SPDR S&P Biotech ETF is challenging nine-month lows.
Tactically, major support spans from about 118.25 to 118.50. An eventual violation opens the path to potentially significant downside follow-through. A projected target scales about 19% lower from the prevailing range.
Traditional sector leaders remain relatively resilient
Amid weakness elsewhere, the traditional sector leaders — the financials, technology sector and transports — remain relatively resilient.
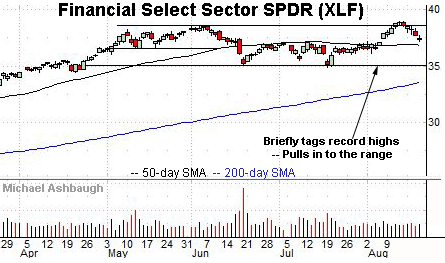
To start, the Financial Select Sector SPDR has pulled in to its range from all-time highs.
Tactically, the 50-day moving average, currently 36.87, has marked an inflection point, making the pending retest a useful bull-bear gauge.
Meanwhile, the Invesco QQQ Trust tracks the Nasdaq 100 Index making it a useful large-cap technology sector proxy.
Tactically, the shares have initially maintained the range bottom (362.40) and the 50-day moving average, currently 359.20. Limited damage has thus far been inflicted.
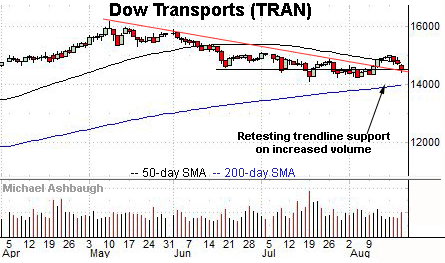
Looking elsewhere, the Dow Transports remain weaker than the other sector leaders.
Still, the group has thus far sustained its August breakout.
Tactically, trendline support roughly matches the former breakdown point (14,475). The group’s recovery attempt is intact barring a violation. (Also see the Aug. 13 review.)
Beyond the U.S. — global benchmarks violate key levels
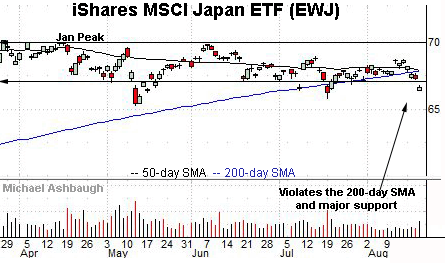
Beyond the U.S., the iShares MSCI Japan ETF has violated its marquee 200-day moving average.
The prevailing downturn punctuates the first consecutive closes under the 200-day since August 2020.
Against this backdrop, a death cross — or bearish 50-day/200-day moving average crossover — has signaled early Friday. (Also see the July 28 review.)
Meanwhile, the iShares MSCI Emerging Markets ETF — profiled Aug. 9, as technically vulnerable — has tagged eight-month lows.
Here again, a death cross — or bearish 50-day/200-day moving average crossover — has signaled early Friday.
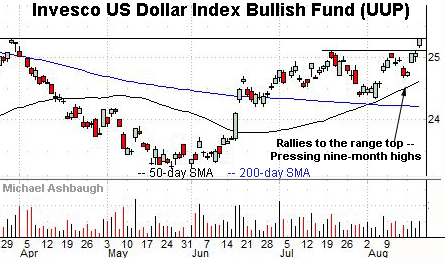
Amid the market cross currents, the U.S. dollar has surged, rising to challenge nine-month highs.
Fundamentally, the dollar has rallied partly amid a safe-haven trade, though the U.S. economy’s resilience versus competing economies has also likely contributed to the August surge.
The prevailing upturn builds on an early-August golden cross, or bullish 50-day/200-day moving average crossover.


