Charting a bull-bear battle, S&P 500 vies to maintain major support
Focus: NYSE registers two 8-to-1 down days, Volatility Index briefly tags eight-month highs
U.S. stocks are higher mid-day Wednesday — though well off the session’s best levels — rising amid a pronounced volatility spike that remains in play.
Against this backdrop, the S&P 500 has thus far weathered an aggressive downdraft initially fueled by heighted virus concerns, and swiftly followed by an unexpectedly hawkish Federal Reserve policy tilt.
Editor’s Note: As always, updates can be directly accessed at chartingmarkets.substack.com.
Before detailing the U.S. markets’ wider view, the S&P 500’s hourly chart highlights the past four weeks.
As illustrated, the S&P concluded November on a shaky note.
The late-month rally attempt stalled near gap resistance (4,664) and the index subsequently reversed to one-month lows.
Tactically, the breakdown point — the 4,620-to-4,635 area — marks familiar overhead. A retest is underway early Wednesday.
(On a granular note, gap resistance (4,664) marked an inflection point before the gap formed. See, for instance, the Nov. 12 review.)
Meanwhile, the Dow Jones Industrial Average remains incrementally weaker.
In its case, the index has asserted a posture under its 50-day moving average, currently 35,303. The post-breakdown peak registered nearby.
From current levels, initial resistance (34,820) is followed by an inflection point matching the May peak (35,091). Both areas are detailed on the daily chart.
Against this backdrop, the Nasdaq Composite remains slightly stronger than the other benchmarks.
As illustrated, its downturn has thus far been underpinned by major support — the 15,400 area — also illustrated below.
Separately, the Nasdaq averted a material “lower low” to conclude November, outpacing the other benchmarks. (The week-to-date low (15,451) has registered just five points under last week’s low, unlike the other benchmarks.)
Widening the view to six months adds perspective.
On this wider view, the Nasdaq has pulled in from last month’s record high.
Still, the downturn has thus far been underpinned by major support matching the breakout point (15,403).
Tactically, a closing violation of the 15,400 area would raise a question mark.
Delving deeper, the 50-day moving average, currently 15,276, is followed by the former range top (15,205). The Nasdaq’s prevailing backdrop supports a bullish intermediate-term bias barring a violation of this area.
Looking elsewhere, the Dow Jones Industrial Average has pulled in more aggressively, placing distance under its breakout point (35,630) and the 50-day moving average.
Notably, the downturn places its 200-day moving average, currently 34,365, within striking distance. Tuesday’s session low (34,424) registered within view, and the index has reversed firmly higher early Wednesday.
As always, the 200-day moving average is a widely-tracked longer-term trending indicator. The Dow has not closed under its 200-day moving average since July 2020.
Beyond technical levels, the Dow’s intermediate-term bias is guardedly bearish-leaning based on today’s backdrop.
A sustained reversal above the Dow’s former range top (34,820) would place the brakes on bearish momentum.
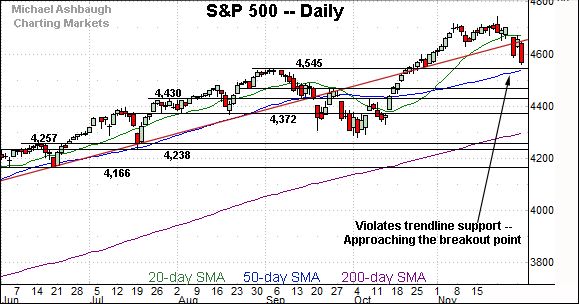
Meanwhile, the S&P 500 has extended its downturn from record territory.
The prevailing pullback places it under trendline support, circa 4,650.
Delving deeper, a more important floor matches the breakout point (4,545) and the 50-day moving average, currently 4,541.
The bigger picture
As detailed above, the major U.S. benchmarks continue to diverge amid a market volatility spike.
Against this backdrop, the S&P 500 and Nasdaq Composite remain relatively resilient, thus far maintaining major support — the S&P 4,545 and Nasdaq 15,400 areas.
Both benchmarks have retained a bullish intermediate-term bias.
Meanwhile, the Dow Jones Industrial Average has violated major support, dropping within striking distance of its marquee 200-day moving average. Its prevailing backdrop supports a bearish intermediate-term bias pending repairs.
More broadly, the major benchmarks have whipsawed amid heighted virus concerns, and an unexpectedly hawkish Federal Reserve policy tilt.
Moving to the small-caps, the iShares Russell 2000 ETF has violated major support, pressured amid a sustained volume spike.
The prevailng downturn places it under the breakout point (229.80) as well as the 50- and 200-day moving averages.
Tactically, the 200-day moving average, currently 224.49, pivots to resistance. A retest from underneath is underway Wednesday.
Meanwhile, the SPDR S&P MidCap 400 ETF has violated its breakout point, circa 506.00, an area closely matching the 50-day moving average.
The downturn places its 200-day moving average, currently 492.50, firmly within view.
Wednesday’s early upturn seems to punctuate a successful retest.
Market breadth signals a question mark
Returning to market breadth, the recent price action raises genuine question marks.
Recall that Friday’s virus-fueled downdraft registered 9-to-1 NYSE negative breadth. (Declining volume surpassed advancing volume by a 9-to-1 margin.)
Fast forward to this week, and Tuesday’s Fed-fueled downdraft induced comparable selling pressure.
Specifically, NYSE declining volume surpassed advancing by a greater than 8-to-1 margin, and a still pedestrian 2-to-1 margin on the Nasdaq.
In a textbook world, two 9-to-1 down days — across about a seven-session window — would reliably signal a material trend shift.
So by this metric, the NYSE has registered two nearly 9-to-1 down days across a narrow three-session window.
The caveat — and this is a big one — is Friday’s downdraft registered amid a Thanksgiving-related half-session. (The markets were open Friday simply to satisfy a regulation that the markets cannot be closed for more than three consecutive days.)
Combined, the prevailing internals raise a question mark, though Friday’s initial downdraft carried a “gotcha” quality. A sustainable market trend shift would not conventionally begin with a half-session plunge.
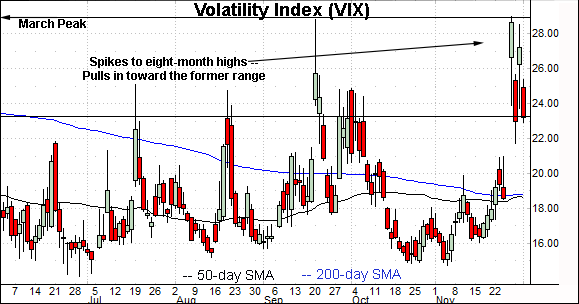
Moving to market sentiment, the Volatility Index (VIX) — a widely-tracked market-fear gauge — has registered a bullish-leaning tilt.
As always, extreme VIX highs signal excessive fear, consistent with durable S&P 500 lows.
Conversely, extreme VIX lows signal investor complacency, consistent with S&P 500 tops.
Against the current backdrop, the Volatility Index has tagged a nominal eight-month high, eclipsing the March peak by six hundredths of a point. (The VIX has also registered a nine-month closing high.)
But here again, the VIX’ new high registered amid Friday’s half-session.
Market bears will note the S&P 500 followed through to a
”lower low” Tuesday, while the VIX did not register a corresponding “higher high.”
Combined, the prevailing backdrop is consistent with a market that’s “getting there” — approaching extreme fear, consistent with a durable market low — though Friday’s half-session makes the signal’s reliability challenging to gauge.
Amid conflicting signals elsewhere, the S&P 500’s backdrop remains comparably straightforward.
To start, the S&P’s trendline, circa 4,650, pivots to resistance.
Wednesday’s early session high (4,652) has registered nearby. A retest remains underway Wednesday.
Conversely, major support matches the breakout point (4,545) and the 50-day moving average, currently 4,541.
Broadly speaking, the S&P 500’s intermediate-term bias remains bullish barring a violation of the 4,540-to-4,550 area. The quality of the prevailing rally attempt will also likely add color.


