Charting bullish follow-through, S&P 500 tags latest record high
Focus: Nasdaq rallies amid market rotation, and shifting leadership
Technically speaking, the U.S. benchmarks’ bigger-picture backdrop remains comfortably bullish.
On a headline basis, each big three U.S. benchmark has recently tagged all-time highs, and the subsequent selling pressure near record territory remains conspicuously limited. The charts below add color:
Editor’s Note: As always, updates can be directly accessed at https://chartingmarkets.substack.com.
Before detailing the U.S. markets’ wider view, the S&P 500’s hourly chart highlights the past four weeks.
As illustrated, the S&P 500 has asserted a higher plateau, holding tightly to record highs.
The prevailing two-week range is narrow, spanning less than 100 points, or 2.0%. More plainly, the pullbacks remain shallow.
Meanwhile, the Dow Jones Industrial Average is traversing a jagged one-month range.
But here again, the prevailing pullback from record highs has thus far inflicted limited damage in the broad sweep. (Also see the daily chart.)
Against this backdrop, the Nasdaq Composite has asserted a higher plateau, price action more closely aligned with the S&P 500.
Tactically, the prevailing range bottom (15,862) closely matches gap support.
Combined, each big three benchmark remains range-bound amid an orderly pullback from all-time highs.
Widening the view to six months adds perspective.
On this wider view, the Nasdaq has pulled in modestly, after tagging an all-time high to start March.
Tactically, the 50-day moving average, currently 15,475, is closely followed by a near-term floor (15,435).
Delving deeper, the breakout point (15,150) marks more important support, a level matching the 2023 peak (15,150). The Nasdaq’s intermediate-term bias remains bullish barring a violation of this area.
Similarly, the Dow Jones Industrial Average is digesting a recent break to all-time highs.
Tactically, the 50-day moving average, currently 38,242, is rising toward gap support (38,620).
Delving deeper, the Dow’s former breakout point — the 37,800-to-37,825 area — remains a notable floor.
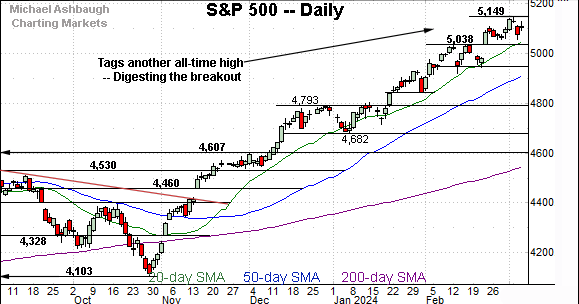
Meanwhile, the S&P 500 has sustained a more decisive February breakout.
More broadly, the index continues to trend atop the 20-day moving average (in green), a widely-tracked near-term trending indicator.
The bigger picture
As detailed above, the major U.S. benchmarks continue to grind higher.
On a headline basis, each big three benchmark has recently tagged all-time highs, and the selling pressure near record territory has thus far been flat. Bullish momentum is intact, based on today’s backdrop.
Moving to the small-caps, the iShares Russell 2000 ETF (IWM) continues to lag behind.
Nonetheless, the small-cap benchmark is pressing its range top, rising to briefly tag 23-month highs.
More broadly, notice the bullish cup-and-handle — defined by the Jan. and mid-Feb. lows — a pattern underpinned by the 50-day moving average. An intermediate-term target projects to the 213 area on follow-through.
True to recent form, the SPDR S&P MidCap 400 ETF (MDY) remains stronger than the small-caps.
In fact, the MDY has knifed to all-time highs, rising from a relatively tight two-month range. (Recall the bullish continuation pattern.)
Tactically, the breakout point (512.50) is closely followed by the ascending 50-day moving average, currently 510.10. The 50-day has marked an inflection point going back before the November trendline breakout.
Returning to the S&P 500, the index continues to trend higher.
Consider that the mid-January breakout placed the S&P at record highs — atop the 2022 peak (4,818) — and the index has since glided higher, rising through previously uncharted territory.
(Put differently, the vast majority of investors are above water following the January breakout. Sellers become scarce in the absence of a cohort seeking to sell at breakeven prices. When sellers are absent, prices generally rise to attract sellers.)
Tactically, gap support (5,038) is followed by a near-term floor (4,920) and the ascending 50-day moving average. (Also see the hourly chart.)
Delving deeper, the S&P’s breakout point (4,793) remains likely last-ditch support, a level matching the 2021 closing high (4,793) and the absolute 2023 peak (4,793).
As always, it’s not just what the markets do, it’s how they do it. But broadly speaking, the S&P 500’s bigger-picture bias remains bullish barring a violation of the 4,790 area.
Also see Feb. 8: Charting a 2024 breakout, S&P 500 (nearly) tags the 5,000 mark.
Also see Dec. 5: Charting market rotation, S&P 500 digests massive late-year rally. (The 10-year Treasury note yield has tagged its 50-day moving average across consecutive sessions.)
Watch List
Drilling down further, two former market leaders are firmly on the defensive:
To start, Apple, Inc. (AAPL) — a former market bellwether — has broken down technically. The prevailing strong-volume downdraft places the shares at four-month lows.
Tactically, gap resistance — the 172.00 and 173.80 areas — are followed by the firmer breakdown point (179.25). A sustained rally atop the breakdown point would mark a step toward stabilization.
Meanwhile, Alphabet, Inc. (GOOGL) — the parent company of Google — has also turned lower.
Recent weakness has been fueled by increased volume, placing the 200-day moving average, currently 132.95, under siege. (As always, the 200-day is a widely-tracked longer-term trending indicator.)
Tactically, trendline resistance is descending toward the breakdown point (135.15). A sustained reversal atop this area would place the shares on firmer technical ground.
More broadly, the charts above signal a resilient broad market, as the Nasdaq Composite grinds higher even amid the recent shift in market leadership. While the Nasdaq previously tracked Apple, it now seems to more closely track Nvidia Corp. (NVDA).


