Charting a bull-bear stalemate, S&P 500 maintains gap support
Focus: Energy sector's breakout attempt, Salesforce.com sustains technical breakout, XLE, CRM, TECK, GOGO, HUT
U.S. stocks are higher early Monday, rising ahead of several influential earnings reports from large-cap banks, due out later this week.
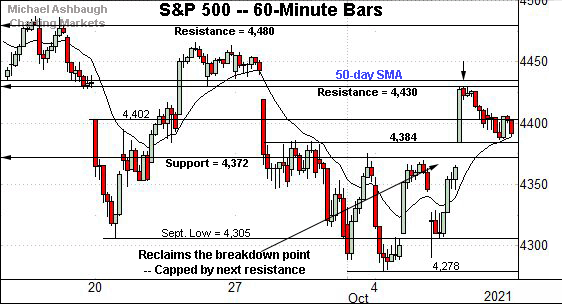
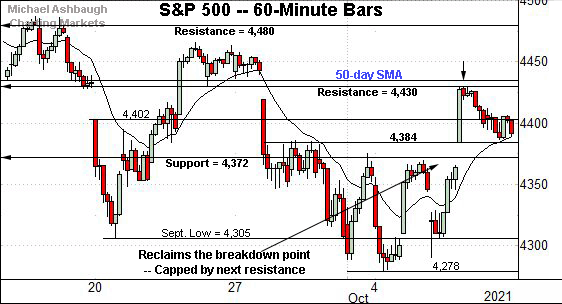
Against this backdrop, the S&P 500 has thus far sustained its corrective bounce, maintaining a posture atop gap support (4,384).
Monday’s early session low (4,384) has matched support to punctuate a successful retest.
Before detailing the U.S. markets’ wider view, the S&P 500’s hourly chart highlights the past four weeks.
As illustrated, the S&P is vying to sustain last week’s bullish reversal.
Tactically, gap support (4,384) is followed by the former breakdown point (4,372).
To reiterate, Monday’s early session low (4384) has matched gap support.
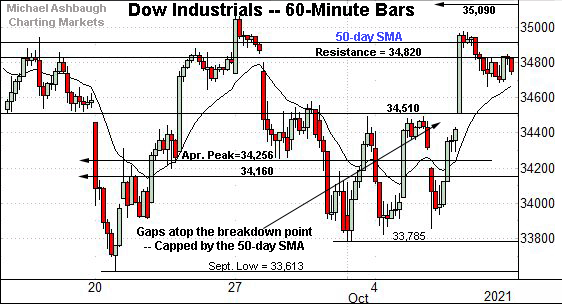
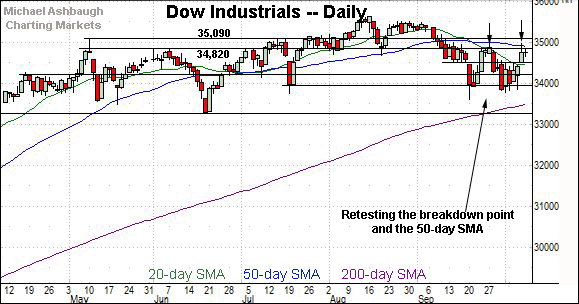
Meanwhile, the Dow Jones Industrial Average has strengthened versus the other benchmarks, holding relatively tightly to its one-month range top.
Tactically, major resistance (34,820) is followed by the 50-day moving average, currently 34,905. The Dow has not closed atop the 50-day since Sept. 8.
Separately, recall that gap support (34,509.7) — (Thursday’s session low) — almost precisely matched the Dow’s former breakdown point (34,510).
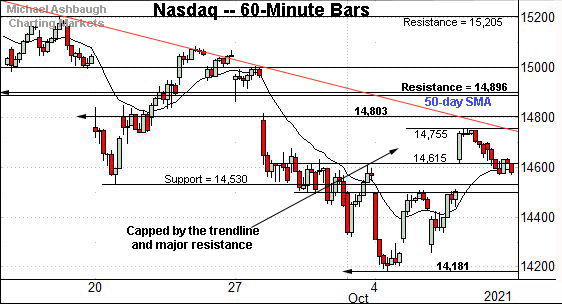
True to recent form, the Nasdaq Composite’s near-term backdrop remains the weakest of the major benchmarks.
Tactically, the October peak (14,755) roughly matches trendline resistance.
More significant overhead matches the breakdown point — the 14,800-to-14,900 area — also illustrated below.
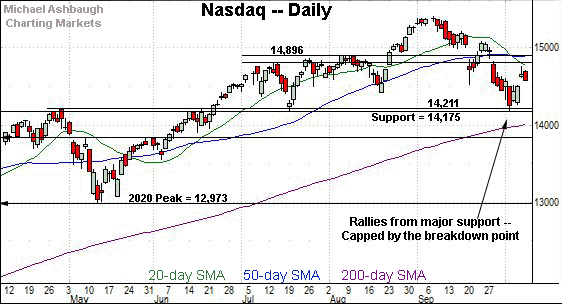
Widening the view to six months adds perspective.
On this wider view, the Nasdaq has sustained a bullish reversal from major support (14,175).
Last week’s low (14,181) — also the October low — punctuated a successful retest.
On further strength, significant resistance broadly spans from 14,803 to 14,896. (The 50-day moving average, currently 14,880, rests within this band.)
Follow-through atop this area would likely neutralize the Nasdaq’s September downdraft.
Looking elsewhere, the Dow Jones Industrial Average continues to strengthen versus the other benchmarks.
Still, the former breakdown point (34,820), and the 50-day moving average, currently 34,905, remain overhead inflection points.
On further strength, more distant resistance matches the late-September peak (35,061) and May peak (35,091). Follow-through higher would punctuate a mini double bottom, likely signaling a bullish intermediate-term bias.
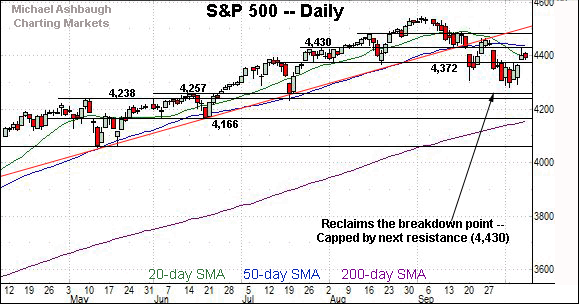
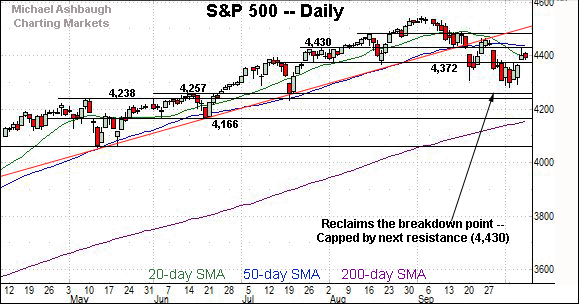
Meanwhile, the S&P 500 has reclaimed its breakdown point (4,372), notching consecutive closes higher.
Still, the upturn has thus far been capped by the S&P’s next notable resistance (4,430).
Recall last week’s high (4,429.97) — also the October peak — effectively matched major resistance.
The bigger picture
As detailed above, the major U.S. benchmarks’ intermediate-term bias technically remains bearish.
Nonetheless, each index has thus far sustained its bullish reversal, maintaining a posture atop key levels — S&P 4,372, Dow 34,510 and Nasdaq 14,530. (See the hourly charts.)
Combined, the prevailing corrective bounce remains underway — for the near-term — amid a still bearish intermediate-term backdrop.
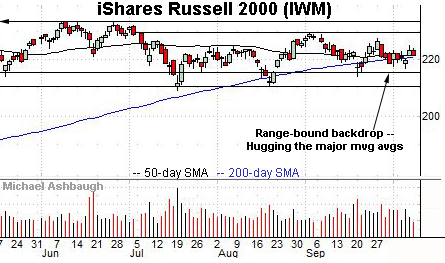
Moving to the small-caps, the iShares Russell 2000 ETF remains range-bound, holding tightly to its major moving averages.
The flatlining 50-day moving average is consistent with a trendless backdrop.
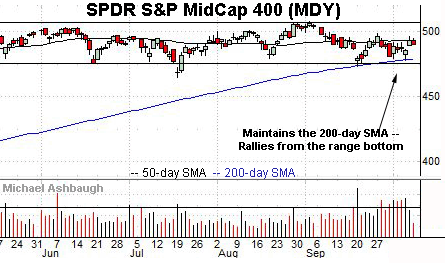
Meanwhile, the SPDR S&P MidCap 400 ETF has maintained its range bottom, an area closely matching the 200-day moving average.
More immediately, an extended retest of the 50-day moving average, currently 492.76, remains underway.
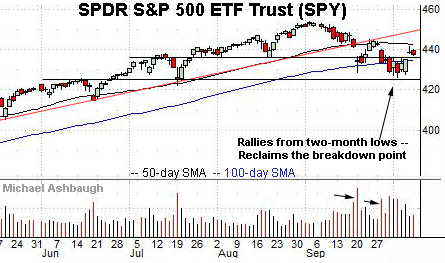
Looking elsewhere, the SPDR Trust S&P 500 ETF has sustained its bullish reversal, though amid decreased volume.
Tactically, follow-through atop the October peak (441.68), and the 50-day moving average, currently 442.84, would strengthen the bull case.
Placing a finer point on the S&P 500, the index is vying to sustain last week’s bullish reversal.
Tactically, Monday’s early session low (4384) has matched gap support (4,384), an area detailed previously. (See Friday’s review.)
Delving slightly deeper, the former breakdown point (4,372) marks a firmer floor.
More broadly, the S&P 500’s rally attempt has thus far stalled at next resistance (4,430).
To reiterate, last week’s high (4,429.97) — also the October peak — matched resistance, nearly to the decimal.
Against this backdrop, the 50-day moving average, currently 4,438, has effectively flatlined to start October, slightly atop the 4,430 resistance.
As detailed last week, eventual follow-through atop the 4,430-to-4,438 area — and ideally, the late-September peak (4,465) — would raise the flag to a bullish intermediate-term trend shift.
Watch List
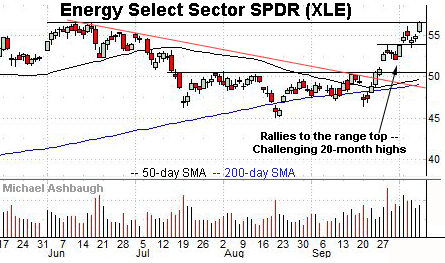
Initially profiled Sept. 24 — amid the break atop trendline resistance — the Energy Select Sector SPDR has returned 11.1%, through a down market, and remains well positioned.
As illustrated, the shares have rallied to the range top, rising to challenge 20-month highs. (Last week’s high technically marked a new high, though by just five cents.)
Tactically, a breakout attempt is in play barring a violation of near-term support, circa 54.10.
More broadly, recall the prevailing upturn punctuates a head-and-shoulders bottom defined by the July, August and September lows.
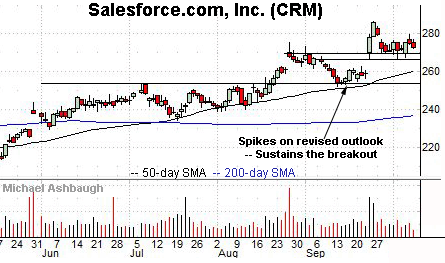
Moving to specific names, Salesforce.com, Inc. is a well positioned large-cap name.
The shares initially spiked three weeks ago, gapping to record highs after the company upwardly revised its fiscal 2022 outlook, and initiated guidance for fiscal 2023.
The subsequent pullback has been flat, positioning the shares to build on the initial strong-volume spike. Tactically, a sustained posture atop gap support (266.40) signals a firmly-bullish bias.
More broadly, the shares are well positioned on the one-year chart, sustaining a rally atop the October 2020 peak.
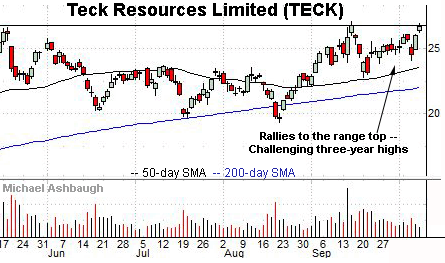
Teck Resources Limited is a large-cap producer of steelmaking coal, copper, zinc and related minerals.
As illustrated, the shares have rallied to the range top, rising to challenge three-year highs. The prevailing upturn punctuates a bullish cup-and-handle defined by the August and September lows.
Tactically, a near-term target projects to the 30.50 area on a break from the range top (26.80).
Conversely, the breakout attempt is intact barring a violation of near-term support, circa 24.55. (The shares may be getting away with Monday’s strong start.)
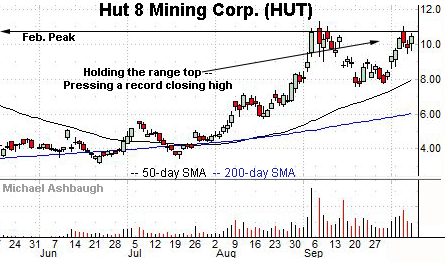
Public since March 2018, Hut 8 Mining Corp. is a Toronto-based mid-cap cryptocurrency miner.
Technically, the shares started September with a strong-volume rally, rising to challenge record highs. (Last week’s close (10.43) marked the second-best close on record, registering slightly under the all-time closing high (10.67).)
The shares have since held tightly to the range top, amid decreased volume, improving the chances of eventual follow-through.
Tactically, a breakout attempt is in play barring a violation of near-term support, circa 9.60.
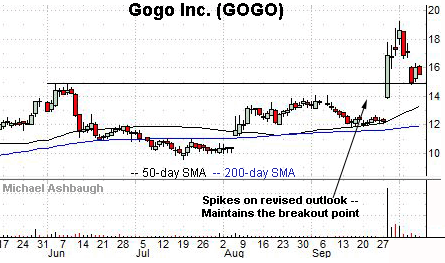
Finally, Gogo, Inc. is a mid-cap provider of in-flight connectivity and entertainment services.
Late last month, the shares knifed to five-year highs, rising after the company’s upwardly revised outlook.
The subsequent pullback has been fueled by decreased volume, placing the shares 23.7% under the October peak. Tactically, a sustained posture atop the post-breakout low (14.85) signals a bullish bias.


