Charting a rabbit-from-hat rally: S&P 500 reclaims the breakdown point
Focus: 10-year yield reclaims key level, Crude-oil prices challenge major resistance, Energy sector's trendline breakout, Japan and Europe diverge, TNX, USO, XLE, EWJ,IEV
U.S. stocks are mixed mid-day Friday, vacillating in the wake of a pronounced market whipsaw.
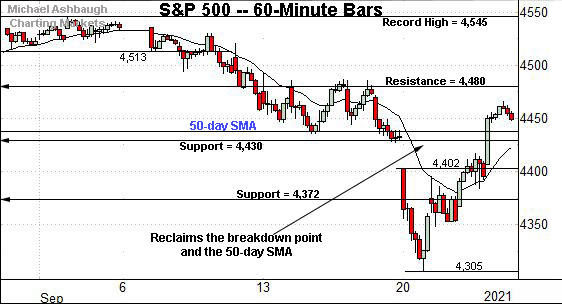
Against this backdrop, the S&P 500 is vying to sustain an arguably surprising rally atop its 50-day moving average, currently 4,439, and the breakdown point (4,430).
Editor’s Note: As always, updates can be directly accessed at chartingmarkets.substack.com.
Before detailing the U.S. markets’ wider view, the S&P 500’s hourly chart highlights the past four weeks.
As illustrated, the S&P has rallied respectably from two-month lows.
To reiterate, the prevailing upturn places the index back atop its 50-day moving average, currently 4,439, and the breakdown point (4,430).
The reversal signals a bullish-leaning intermediate-term bias to the extent the S&P can sustain a posture atop this area. (This area “should” have drawn selling pressure if market bears were setting the tone.)
Meanwhile, the Dow Jones Industrial Average has rallied from three-month lows.
Still, the index remains capped by its breakdown point (34,820) and the more distant 50-day moving average, currently 34,986.
On a granular note, the April peak (34,256) formerly marked an inflection point, and returned to relevance this week. Wednesday’s close (34,258) registered nearby.
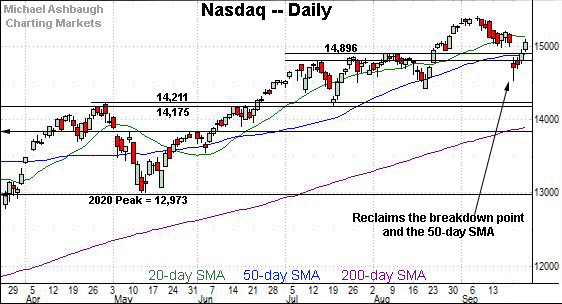
Against this backdrop, the Nasdaq Composite has rallied sharply from one-month lows.
The upturn places the index atop its breakdown point (14,896), a key bull-bear inflection point, detailed repeatedly.
Consider that Wednesday’s close (14,896) precisely matched the breakdown point. The Nasdaq has since sustained a break higher.
Widening the view to six months adds perspective.
On this wider view, the Nasdaq seems to have weathered the September whipsaw.
Tactically, the breakdown point (14,896) effectively matches the 50-day moving average, currently 14,897.
To reiterate, Wednesday’s close (14,896) matched both inflection points, and the Nasdaq has since followed through higher. The prevailing upturn has filled the September gap.
The relatively swift reversal signals a bullish intermediate-term bias to the extent the Nasdaq sustains a posture atop this area.
Looking elsewhere, the Dow Jones Industrial Average has rallied respectably from three-month lows.
Still, the index remains capped by its breakdown point (34,820) and the more distant 50-day moving average, preserving a bearish intermediate-term bias.
Meanwhile, the S&P 500 is vying to sustain a rally atop two notable levels.
The specific areas, detailed previously, match the 50-day moving average, currently 4,439, and the breakdown point (4,430).
The bigger picture
As detailed above, the U.S. benchmarks have rallied respectably from the September low, rising at least partly amid well received Federal Reserve policy language.
Still, the prevailing backdrop presents a challenge in the sense that “Fed-statement-fueled” market moves frequently register as one- to two-day wonders, lacking sustainability. The weekly close will likely add color.
More broadly, this week’s price action punctuates the U.S. benchmarks’ least straightforward backdrop across the span Charting Markets has been published on Substack.
Moving to the small-caps, the iShares Russell 2000 ETF continues to strengthen versus the major U.S. benchmarks, maintaining a posture firmly atop the August low.
Similarly, the SPDR S&P MidCap 400 ETF remains range-bound, rising from major support closely matching the 200-day moving average.
Looking elsewhere, the SPDR Trust S&P 500 ETF has reversed respectably from two-month lows.
Still, the prevailing upturn has been fueled by decreased volume (which is not necessarily so concerning) and comparably tame internal strength (which does raise a question mark).
Consider that Thursday’s NYSE advancing volume surpassed declining volume by a 4-to-1 margin.
By comparison, Monday’s downdraft registered unusually bearish extremes, a greater than 8-to-1 down day. (This marked particularly unusual bearish strength in the context of 2021.)
Tactically, sustained follow-through atop the 50-day moving average, currently 442.98, and trendline resistance, circa 445, would more firmly neutralize the September downdraft.
On the positive side, recall previous volume spikes have punctuated durable intermediate-term lows. (See the arrows.)
Placing a finer point on the S&P 500, the index has reversed nearly immediately atop two key levels.
Namely, the breakdown point (4,430), and the 50-day moving average, currently 4,439.
More broadly, the S&P 500’s bullish reversal this week has already filled the September gap.
Broadly speaking, this area — the breakdown point (4,430) and the 50-day moving average — “should” have drawn selling pressure if market bears were dictating the technical tone.
To be sure, the bigger-picture backdrop has softened this week amid internally aggressive selling pressure, inflicting material sub-sector damage in spots.
Nonetheless, price action generally trumps other indicators, in this case supporting the bull case.
Tactically, the S&P 500 has asserted a guardedly-bullish intermediate-term bias to the extent it sustains its reversal atop the breakdown point — the 4,430 area.
Watch List — Rising interest rates and energy prices
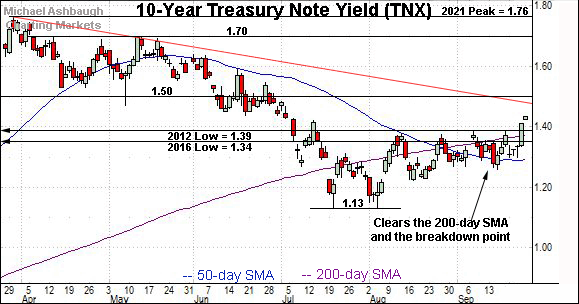
Drilling down further, the 10-year Treasury note yield has cleared headline levels after the Federal Reserve’s mid-week policy statement.
To start, the yield has reclaimed its breakdown point, an area matching the 2016 low (1.34) and 2012 low (1.39).
Moreover, the prevailing upturn places the yield atop its 200-day moving average, currently 1.37.
Tactically, the relatively decisive break atop the two key areas is consistent with a potentially consequential trend shift.
Delving deeper, the yield’s breakout originates from the 50-day moving average, a familiar bull-bear inflection point. (Also see the Aug. 30 review.)
Meanwhile, the United States Oil Fund has also turned higher amid market volatility. The fund tracks the spot price of light, sweet crude oil.
In the process, the shares have tagged 18-month highs, the best levels since March 2020, as the pandemic was taking hold.
The prevailing upturn builds on a recent bullish trend shift, detailed previously. (See the Sept. 17 review.)
More immediately, the slight breakout opens the path to much less-charted territory, and potentially material upside follow-through.
Combined, the question is whether surging yields and energy prices ultimately present a market headwind, or in the current case, simply signal accelerating global growth. (The former seems more likely.)
Moving to U.S. sectors, the Energy Select Sector SPDR is showing signs of life amid surging oil prices.
Technically, the group has edged atop trendline resistance, tagging two-month highs.
The prevailing upturn punctuates a head-and-shoulders bottom defined by the July, August and September lows.
Separately, the upturn places the group atop its 50- and 200-day moving averages. Tactically, the breakout attempt is intact barring a violation of the 50-day moving average, currently 48.70.
Beyond the U.S. — Global market cross currents persist
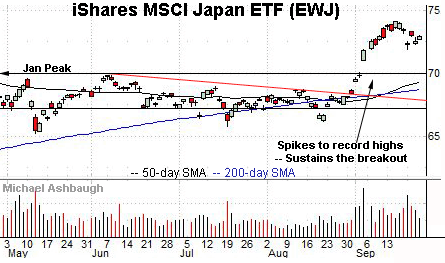
Beyond the U.S., the iShares MSCI Japan ETF — profiled Sept. 1, amid a trendline breakout — is digesting a decisive spike to record territory.
The flattish prevailing pullback preserves a comfortably bullish longer-term bias.
Tactically, the post-breakout low (71.88) is followed by gap support (71.04) and the firmer the breakout point (69.80). The prevailing rally attempt is intact barring a violation.
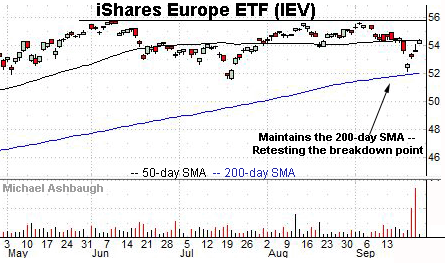
Finally, the iShares Europe ETF is tenuously positioned amid recent volatility.
Earlier this week, the shares briefly tagged two-month lows while still maintaining the 200-day moving average, currently 52.04.
The subsequent rally attempt has perhaps strangely been fueled by a volume spike.
Tactically, the breakdown point (53.84) is closely followed by the 50-day moving average, currently 54.34. Sustained follow-through atop this area would place the shares on firmer technical ground. The prevailing retest from underneath should be a useful bull-bear gauge.


