Charting a lackluster rally attempt: S&P 500 nails next resistance (4,430)
Focus: Sector leaders diverge amid cross currents, Amazon survives major test, Europe and Japan assert bearish posture, XLF, TRAN, QQQ, AMZN, IEV, EWJ
U.S. stocks are mixed early Friday, vacillating after a much weaker-than-expected monthly U.S. jobs report.
Against this backdrop, the S&P 500 has reversed respectably from the October low — reclaiming its breakdown point (4,372) — though amid a rally attempt that technically gets low marks for style.
Editor’s Note: As always, updates can be directly accessed at chartingmarkets.substack.com.
Before detailing the U.S. markets’ wider view, the S&P 500’s hourly chart highlights the past four weeks.
As illustrated, the S&P has rallied respectably from the October low, rising to reclaim its breakdown point (4,372).
Still, the rally has thus far stalled at its next significant resistance (4,430) an area also detailed on the daily chart.
Thursday’s session high (4,429.97) matched resistance, nearly to the decimal.
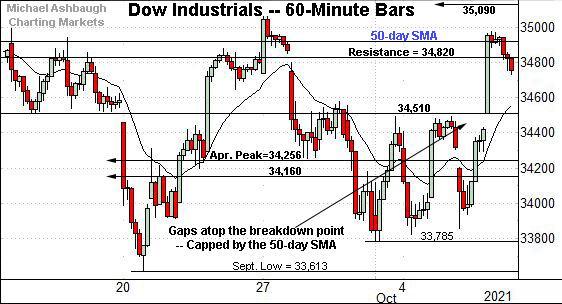
Similarly, the Dow Jones Industrial Average has reclaimed its breakdown point (34,510), a bull-bear inflection point detailed repeatedly.
In fact, Thursday’s session low (34,509.7) matched the breakdown point, and the index subsequently followed through firmly higher.
On further strength, the 34,820 resistance, and 50-day moving average, currently 34,907, remain overhead hurdles.
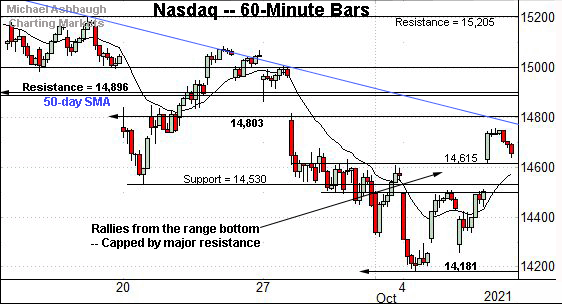
Meanwhile, the Nasdaq Composite’s near-term backdrop remains the weakest of the major benchmarks.
But here again, the index has reclaimed notable resistance, an area matching the mid-September low (14,530).
More broadly, the upturn originates from major support (14,175) an area also detailed on the daily chart below.
The October low (14,181) has registered nearby.
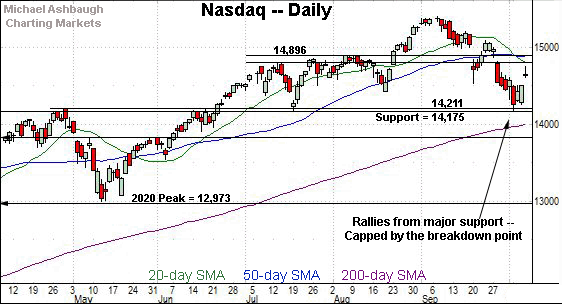
Widening the view to six months adds perspective.
On this wider view, the Nasdaq has reversed sharply from its breakout point (14,175), an area detailed repeatedly.
To reiterate, the early-week low (14,181) punctuated a successful retest.
Conversely, the index remains capped by its breakdown point, an area broadly spanning from 14,803 to 14,896.
Tactically, eventual follow-through atop this area would likely neutralize the Nasdaq’s recent downdraft. The pending retest from underneath should add color.
(On a granular note, see Thursday’s bearish gravestone doji, a pattern also detailed as it applies to the QQQ’s backdrop in the next section.)
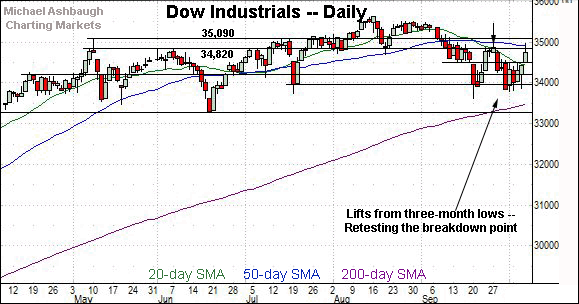
Looking elsewhere, the Dow Jones Industrial Average has strengthened versus the other benchmarks to start October.
Against this backdrop, the former breakdown point (34,820), and 50-day moving average, currently 34,907, remain overhead inflection points.
Friday’s early session high (34,830) has roughly matched resistance.
Meanwhile, the S&P 500 has reclaimed its breakdown point (4,372), notching its first October close higher.
Still, the prevailing upturn has been capped by the S&P’s next notable resistance (4,430).
To reiterate, Thursday’s session high (4,429.97) — also the October peak — effectively matched major resistance.
The bigger picture
Collectively, the U.S. benchmarks’ intermediate-term bias remains bearish based on today’s backdrop.
Nonetheless, each index has reversed respectably from the October low, rising to reclaim key technical levels — S&P 4,372, Dow 34,510 and Nasdaq 14,530. (See the hourly charts.)
To be sure, the prevailing rally attempt gets mixed marks for style, at best, as measured by volume, internal strength and price action.
But the capacity to clear initial resistance signals waning bearish momentum, even if perhaps only for the near-term. The rally attempt’s sustainability and upside follow-through remain question marks.
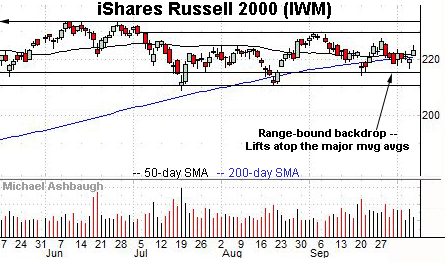
Moving to the small-caps, the iShares Russell 2000 ETF has virtually flatlined amid volatility elsewhere
The small-cap benchmark continues to hug its 50- and 200-day moving averages.
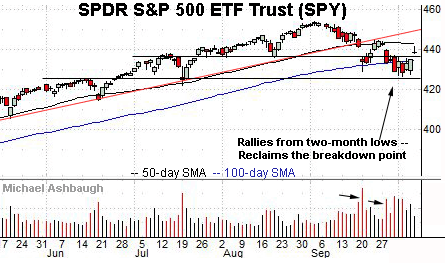
Looking elsewhere, the SPDR Trust S&P 500 ETF seems to have staged a corrective bounce from the October low.
The prevailing upturn has been fueled by decreased volume, and punctuated by Thursday’s lackluster positive breadth.
For instance, NYSE advancing volume surpassed declining volume by about a 3-to-1 margin, a reading comparably softer than that fueling the preceding strong-volume downturn.
Separately, consider Thursday’s bearish gravestone doji, signaling lackluster upside momentum. The single-day pattern is characterized by a session open and close that roughly match — and register near the session low — capped by a long upper shadow.
Combined, the SPY has reclaimed its breakdown point (436.10) though the bullish reversal gets low marks for style.
Returning to the S&P 500’s six-month view adds color.
On a positive note, the S&P has reclaimed its breakdown point (4,372), an early bull-bear inflection point, detailed repeatedly. The prevailing near-term bounce is intact barring a violation of this area.
Still, the rally has thus far stalled at next resistance (4,430).
To reiterate, Thursday’s session high (4,429.97) — also the October peak — matched resistance, nearly to the decimal.
Against this backdrop, the 50-day moving average, currently 4,438, is descending toward resistance (4,430).
Tactically, eventual follow-through atop the 4,430-to-4,438 area — and ideally, the late-September peak (4,465) — would raise the flag to a bullish intermediate-term trend shift.
Watch List — Traditional sector leaders diverge
Drilling down further, pronounced sector cross currents remain in play. The traditional sector leaders — the financials, transports and technology sector — exemplify the uneven backdrop:
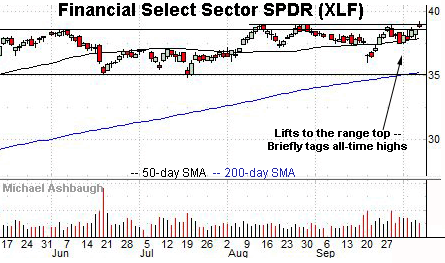
To start, the Financial Select Sector SPDR — profiled Monday — continues to exhibit relative strength.
In fact, the group briefly tagged all-time highs in Thursday’s action.
The prevailing upturn punctuates a successful test of the 50-day moving average at the October low. A near-term target projects to the 40.30 area on follow-through.
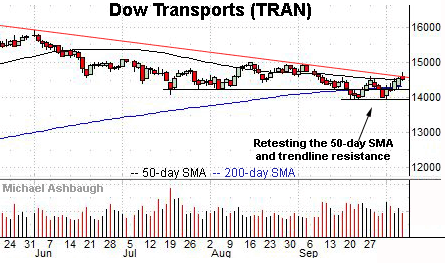
Meanwhile, the Dow Transports have reached a significant technical test.
Specifically, the group is challenging trendline resistance, circa 14,580, and the 50-day moving average, currently 14,518.
The prevailing upturn punctuates a mini double bottom defined by the September and October lows.
Tactically, eventual follow-through atop the September peak (14,936) would mark a material “higher high” more firmly signaling a trend shift.
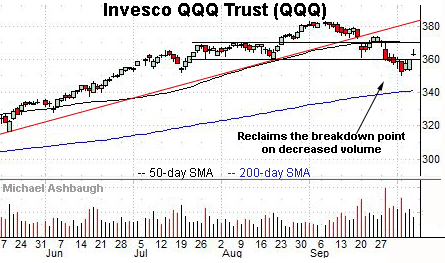
Scaling down in strength, incrementally, the Invesco QQQ Trust tracks the Nasdaq 100 Index and acts as a large-cap technology sector proxy.
As illustrated, the shares have reclaimed the breakdown point, circa 360.00, though amid decreased volume.
And here again, the prevailing rally attempt has been punctuated by Thursday’s gravestone doji. (Also see the SPDR Trust S&P 500’s backdrop.)
Combined, the reversal atop the breakdown point is constructive, though the rally attempt thus far gets quite low marks for style.
Summing up the sector backdrop
Collectively, the groups detailed exemplify an uneven sector backdrop, amid rotational price action, in spots. A sideways broad-market chop, through year-end, might be a good-case scenario based on today’s backdrop.
Amazon reaches major technical tests
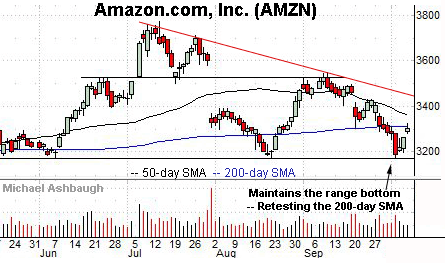
Moving to an influential name, Amazon.com has reached potentially consequential tests.
To start, the shares have maintained major support matching a five-month range bottom — the 3,172-to-3,176 area.
Still, the prevailing upturn has been fueled by decreased volume, and thus far capped by the 200-day moving average, currently 3,313.30.
Tactically, follow-through atop the 200-day — and the slightly more distant 50-day moving average — would mark steps toward stabilization.
More broadly, notice the pending death cross — or bearish 50-day/200-day moving average crossover — signaling the intermediate-term downtrend may be overtaking the longer-term trend.
Europe and Japan reach key tests amid bearish price action
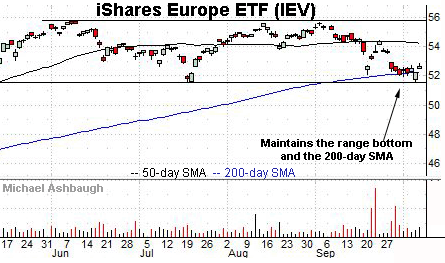
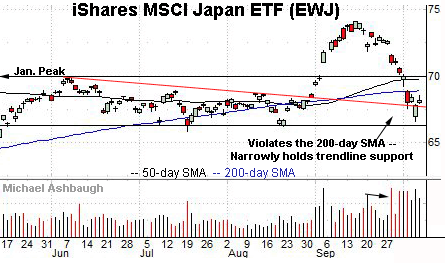
Beyond the U.S., Europe and Japan have reached key technical tests amid recently shaky price action:
To start, the iShares Europe ETF has thus far weathered an extended test of its 200-day moving average, currently 52.30.
Still, market bears will point to a developing double top, defined by the June and September peaks.
Tactically, an eventual violation of the range bottom (51.54) would resolve the bearish pattern, opening the path to potentially swift downside follow-through.
Conversely, a rally atop gap resistance (52.90), and the 50-day moving average, would place the shares on firmer technical ground.
Meanwhile, the iShares Japan ETF has staged an aggressive strong-volume plunge, violating its breakout point (70.00) and the 200-day moving average, currently 68.90.
Bearish price action.
But on a slightly positive note, the shares have also narrowly maintained trendline support on a closing basis.
Tactically, a reversal atop the breakdown point — the 70.00 area — would likely neutralize the recent downdraft. The pending retest from underneath should be a useful bull-bear gauge.


