Charting bearish follow-through, S&P 500 ventures under major support (3,900)
Focus: 10-year Treasury yield takes flight to 11-year highs
Technically speaking, the U.S. benchmarks continue to trend lower, pressured at least partly amid surging Treasury yields.
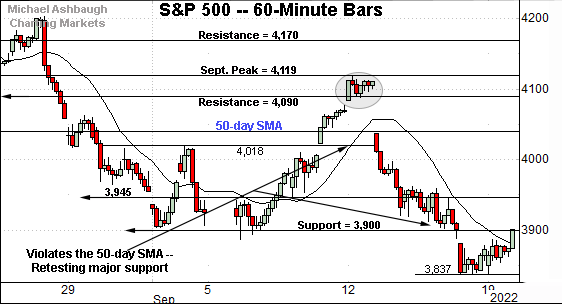
Against this backdrop, the S&P 500 has ventured back under major support (3,900), a headline bull-bear inflection point. The response to the Federal Reserve’s mid-week policy statement will likely add color.
Editor’s Note: As always, updates can be directly accessed at https://chartingmarkets.substack.com.
Before detailing the U.S. markets’ wider view, the S&P 500’s hourly chart highlights the past four weeks.
As illustrated, the S&P has pulled in to major support (3,900) — detailed previously — an area also illustrated on the daily chart.
Monday’s close (3,899.9) matched support amid an extended retest.
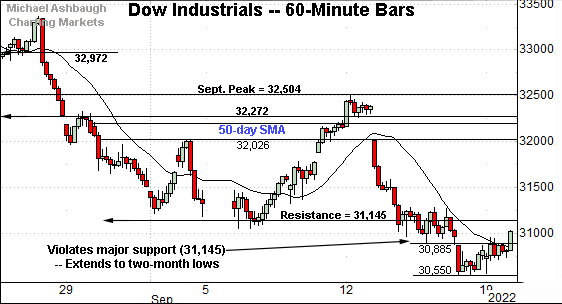
Similarly, the Dow Jones Industrial Average has extended its downturn.
The prevailing pullback places it under major support (31,145) an area that pivots to resistance.
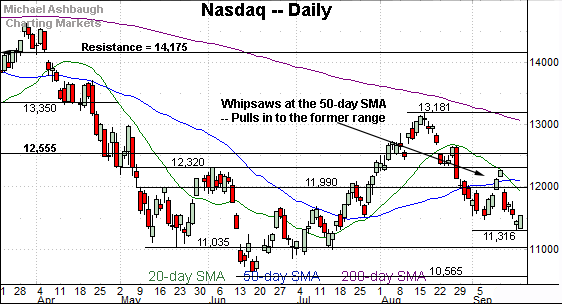
Against this backdrop, the Nasdaq Composite has also tagged two-month lows.
The prevailing downturn punctuates a small island reversal at the September peak.
(Recall the S&P 500’s similar reversal at the September peak.)
Widening the view to six months adds perspective.
On this wider view, the Nasdaq has extended a downturn toward the six-month range bottom.
Recent weakness punctuates a September whipsaw at the 50-day moving average.
Slightly more broadly, the 50% retracement of the downturn from the August peak to the September low rests at 12,326, closely matching the 12,320 resistance. This area also defines the June peak (12,320), a level from which the plunge to the 2022 low (10,565) originated.
Looking elsewhere, the Dow Jones Industrial Average has violated major support.
The specific area matches the June gap (31,145) and the Sept. 6 close (also 31,145) the level from which the September rally attempt originated.
Also recall that last week’s 1,276-point single-day downdraft — amid a violation of the 50-day moving average — marked the Dow’s seventh-largest point loss in history.
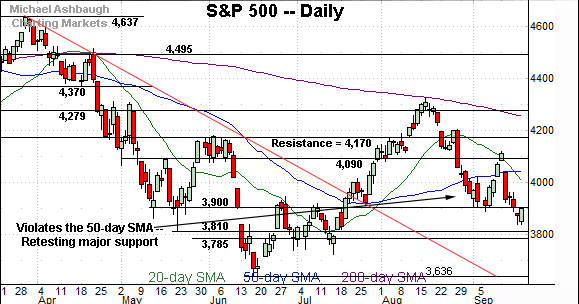
Meanwhile, the S&P 500 has pulled in to a notable technical test.
As detailed previously, major support matches the May closing low (3,900), the June gap (also 3,900) and the early-summer range top.
Monday’s close (3,899.9) matched support (technically now resistance) amid a retest from underneath.
The bigger picture
As detailed above, the U.S. benchmarks’ bigger-picture backdrop remains bearish.
On a headline basis, each big three U.S. benchmark has tagged two-month lows, extending an aggressive downdraft from the September peak.
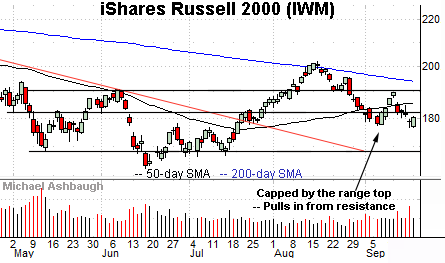
Moving to the small-caps, the iShares Russell 2000 ETF (IWM) has extended a pullback from resistance.
The prevailing downturn punctuates a failed test of the former range top (190.90) and places the small-cap benchmark back under its 50-day moving average, currently 185.80.
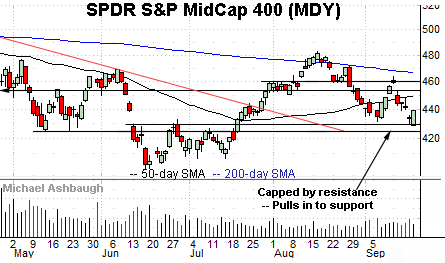
Meanwhile, the SPDR S&P MidCap 400 ETF (MDY) has pulled in to support matching the June gap (429.70).
More broadly, the small- and mid-cap benchmarks remain capped by the descending 200-day moving average, signaling a longer-term downtrend.
Returning to the S&P 500, the index has extended a downturn from the September peak.
Tactically, the 50-day moving average, currently 4,042, roughly matches the bottom of the September gap (4,037). A rally atop this area would mark technical progress.
On further strength, follow-through atop the 4,090-to-4,120 area would more firmly raise the flag to an intermediate-term trend shift. (Also see the hourly chart.)
More immediately, the 3,900 mark remains a headline inflection point.
This week’s violation of the 3,900 area marks a material “lower low” to punctuate a failed test of the 200-day moving average at the August peak. Bearish price action.
Separately, the S&P 500 has just registered its longest stretch under the 200-day moving average since 2008-2009, amid the height of the financial crisis. Its intermediate- to longer-term path of least resistance continues to point lower.
Also see Sept. 15: Bearish momentum persists: S&P 500 and Dow industrials retest major support.
Watch List
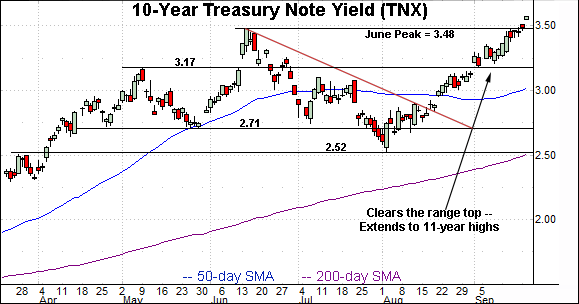
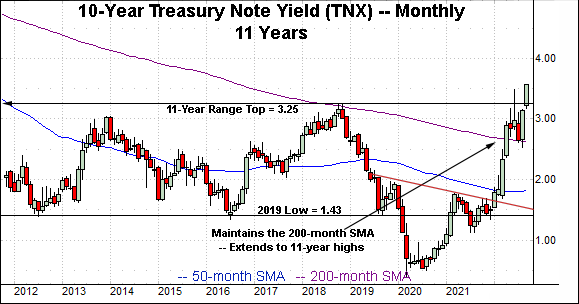
Concluding on a stray note, the 10-year Treasury note yield (TNX) seems to be taking flight.
As illustrated, the yield has knifed above its 11-year range top (3.25), tagging its highest level since April 2011.
The prevailing upturn builds on the massive early-2022 trendline breakout, and subsequent sideways range, underpinned by the 200-month moving average.
As detailed previously, the yield’s breakout opens the path to a less-charted patch, and potentially swift upside follow-through. The response to the Federal Reserve’s policy directive, due out Wednesday, will likely add color.
(Also see the Aug. 23 review, amid the yield’s trendline breakout on the daily chart.)


