


Charting a bull-trend pullback, U.S. benchmarks close out strong first-half 2023
Focus: Dow industrials nail 50-day average, Russell 2000 holds 200-day average

Technically speaking, the major U.S. benchmarks seem poised to conclude June — and the first-half 2023 — amid a firmly bullish bigger-picture backdrop.
On a headline basis, the S&P 500 and Nasdaq Composite have sustained aggressive June breakouts, consolidating amid thus far muted selling pressure.
Meanwhile, the Dow Jones Industrial Average has maintained its 50-day moving average against a backdrop that continues to set up well for longer-term uspide.
Editor’s Note: As always, updates can be directly accessed at https://chartingmarkets.substack.com.
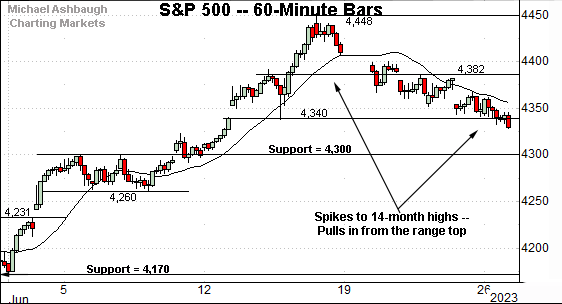
Before detailing the U.S. markets’ wider view, the S&P 500’s hourly chart highlights the past four weeks.
As illustrated, the S&P 500 is digesting a sharp rally to 14-month highs.
From current levels, the 4,300 area marks the first notable floor. The early-month bull-flag breakout originates from this area.
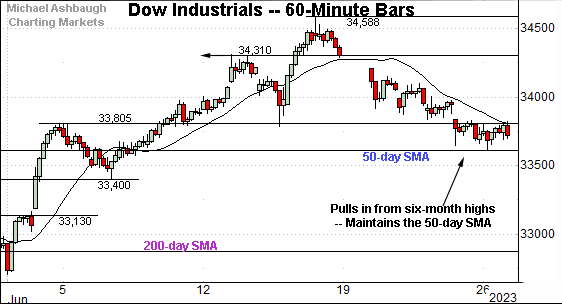
Meanwhile, the Dow Jones Industrial Average has reversed from six-month highs.
The prevailing pullback has been underpinned by the 50-day moving average, currently 33,612.
The week-to-date low (33,610) has effectively matched the 50-day moving average.
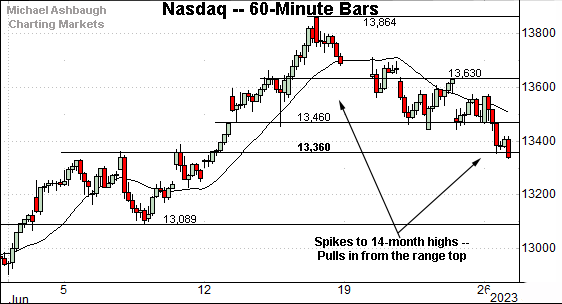
Against this backdrop, the Nasdaq Composite has pulled in from 14-month highs.
Tactically, near-term support is not so well-defined — as illustrated below — though the 13,360 and 13,460 areas mark inflection points.
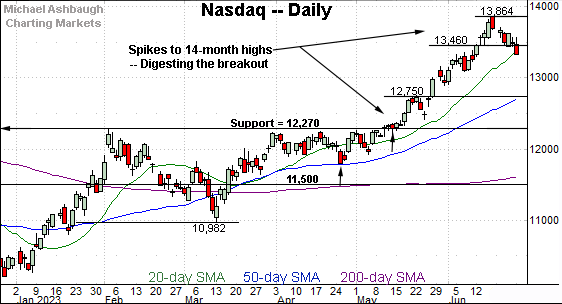
Widening the view to six months adds perspective.
On this wider view, the Nasdaq is digesting a massive May/June breakout.
The initial spike spanned 1,594 points, or 13.0%, atop the breakout point (12,270).
More immediately, the prevailing pullback has been comparably shallow — amid muted selling pressure — signaling longer-term bullish momentum is intact. (Recall the initial rally marked a two standard deviation breakout, encompassing three separate closes atop the 20-day volatility bands.)
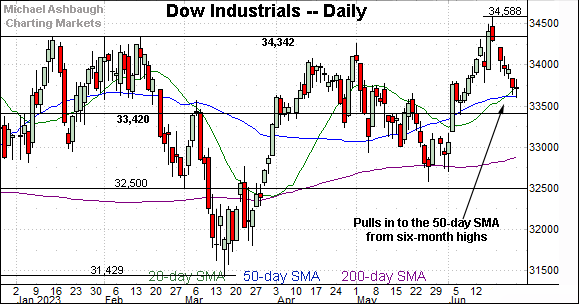
Looking elsewhere, the Dow Jones Industrial Average has pulled in from its range top.
The prevailing downturn has been underpinned by the 50-day moving average, currently 33,612.
The late-June low (33,610) has registered nearby. (The 50-day moving average also marked a February inflection point.)
More broadly, the Dow is rising from a head-and-shoulders bottom, defined by the December, March and June lows. As detailed previously, this is a high-reliability pattern, and lays the groundwork for potentially aggressive upside follow-through.

Meanwhile, the S&P 500 has reversed from 14-month highs.
Tactically, the 4,300 mark is followed by the firmer breakout point (4,170).
More broadly, the initial June spike registered statistically unusual bullish momentum, detailed previously.
The bigger picture
As detailed above, the bigger-picture backdrop remains comfortably bullish.
On a headline basis, the S&P 500 and Nasdaq Composite have pulled in from 14-month highs, pressured amid thus far flat selling pressure. Bullish momentum is intact.
Meanwhile, the Dow Jones Industrial Average has maintained its 50-day moving average amid a backdrop that continues to set up well for longer-term uspide. (See the daily chart.)
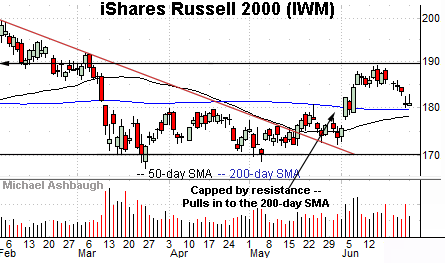
Moving to the small-caps, the iShares Russell 2000 ETF (IWM) is digesting its June breakout.
The prevailing pullback has been underpinned by the 200-day moving average, currently 179.62, an area closely matching the breakout point.
Conversely, the June rally attempt stalled just under next resistance (189.90) a level matching its projected target in the 190 area.
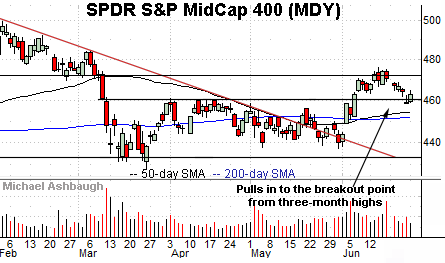
Similarly, the SPDR S&P MidCap 400 ETF (MDY) is digesting its June breakout.
Tactically, the recent pullback has been punctuated by a jagged test of the breakout point (460.90).
Combined, the small- and mid-caps have maintained major support — at least so far — amid a rally attempt that is vying to broaden.

Returning to the S&P 500, this next chart is a weekly view spanning 30 months. Each bar on the chart represents one week.
As illustrated, the S&P is consolidating a sharp break to 14-month highs. The initial pullback has been comparably flat, signaling that bullish momentum is intact.
More broadly, recall a longer-term target projects from the prior range to the 4,545 area. (Start with 4,170 - 3,810 = 360. Then, add the result back to the breakout point: 4,170 + 360 = 4,530.)

Narrowing to the S&P 500’s six-month view adds perspective.
As illustrated, the S&P is consolidating an aggressive June breakout. The initial spike spanned 277 points, or 6.6%, atop the breakout point (4,170). By comparison, the subsequent pullback has been orderly, punctuated by muted selling pressure.
Against this backdrop, the “expected” consolidation phase — or sideways chop — remains in play. (See the April/May price action, hinged to the rally off the March low.)
Tactically, the 4,300 mark matches the S&P’s former upside target (4,290). This area remains first support.
Delving deeper, the 50-day moving average, currently 4,210, is followed by the more important breakout point (4,170).
As always, it’s not just what the markets do, it’s how they do it. But broadly speaking, the S&P 500’s bigger-picture bias remains bullish barring a violation of the 4,170 area.
(On a granular note, the S&P’s 38% Fibonacci retracement of the June spike rests at 4,342, matching an inflection point (4,340) on the hourly chart.)
Also see June 6: Bull trend broadens, S&P 500 knifes to nine-month highs.